


COVID-19 is crippling economies and creating turmoil in financial markets. This note gives our outlook for coal generation in 2020 due to COVID-19 and highlights the opportunity available to governments to avoid new coal and push for win-win reforms to retire and replace the existing fleet.
Into the unknown
COVID is disrupting energy markets in ways previously unimaginable. Gas prices are at multi-decade lows throughout the world.[i] Oil prices could go negative in some markets according to analysts at Goldman Sachs.[ii] At the time of writing, EU carbon prices have tanked, collapsing 45% in March. Thermal coal (the coal used for power generation) has been relatively unscathed from the malaise in other markets, with API2 declining 12% over the same period having dropped by the same amount in 2019.[iii] Despite this, total power demand is being hit as economies go into hibernation due to social isolation policies.[iv]
For this reason, we are expecting coal generation to decrease significantly in 2020. We expect generation to decline between 6.8% to 20.3% year-on-year (yoy), as power demand declines as economies contract. Even in our most optimistic scenario – a reduction of 6.8% yoy will be the largest decline in recent history.[v] As detailed by Ember, it is not yet clear that falling coal generation is the ‘new normal’.[vi] It is clear however that the expected decline in generation in 2020 conflicts with under-construction and planned capacity additions. Governments are still proposing to build more coal. According to Global Energy Monitor, there is around 200 GW of capacity under construction and another 300 GW in various stages of development.[vii] A number of these projects are now stalling as funding dries up due to the aforementioned turmoil in financial markets.[viii] Perhaps more importantly, building more capacity does not necessarily result in more generation. Governments are currently implicitly creating a $630 bn stranded asset problem, which could be exacerbated by COVID-19.[ix]
Figure 1. Outlook for coal generation in 2020 based on global GDP forecasts of 1.5%, -2% and -4%
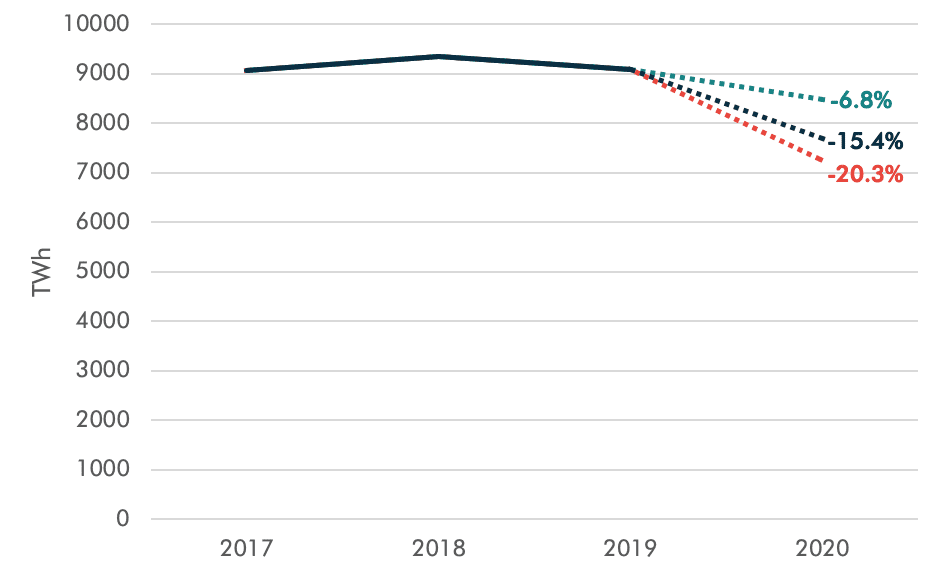
Source: Ember, World Bank, Carbon Tracker analysis
Notes: This analysis is based on a simple regression model, which predicts demand based on the relationship between coal generation and GDP growth over the last 12 years (2008 to 2019). High, base and low scenarios are based on global GDP forecasts of 1.5%, -2% and -4%, respectively. The -4% estimate is based on analysis from the UK’s Centre for Economics and Business Research.[x]
Variable sensitivity analysis
There are three primary variables that influence the unit economics of coal power: coal prices, capacity factors and carbon prices. According to our boiler-level or “asset-level” model we find the following:
- Coal prices. Coal prices represent 75% of the long-run marginal cost and therefore are the most important variable. For every $1/t move in the fuel price, operating cashflows increase or decline $0.44/MWh. Half of thermal coal production and consumption is from China, making it overwhelmingly important for fuel price direction. If Chinese policymakers do not change their coal price policy[xi] and pursue a coal-heavy stimulus, then we expect prices to remain at current levels.
- Capacity factors. Capacity factors influence fixed operations and maintenance (O&M) costs as these costs are spread over more or less hours which decreases or increases operating costs. Fixed O&M represents 8% of the long-run marginal cost. For every 1 percentage point move in the capacity factor, operating cashflows increase or decline $0.42/MWh. The global average capacity factor in 2019 was 53% well below technical specifications of 80% to 90%. If governments build and operate the 500 GW of under-construction and planned coal capacity, they will drive capacity factors to prohibitively low levels.
- Carbon prices. As detailed above, EU carbon prices have crashed 45% (from €24/t to €15/t) in March, leading to calls to adjust the Market Stability Reserve.[xii] We think this is misguided. EU coal to gas switch levels are at €9/t – well below the prevailing price of €16/t. This means, despite lower prices, the EU ETS is driving hard coal off the EU’s power system in manner that has no historical precedent. Moreover, the average carbon price for the entire global coal fleet is a paltry $2.7/t, making the EU price crash trivial from a macro perspective.
Figure 2. EU hard coal and lignite fuel switch prices in 2020
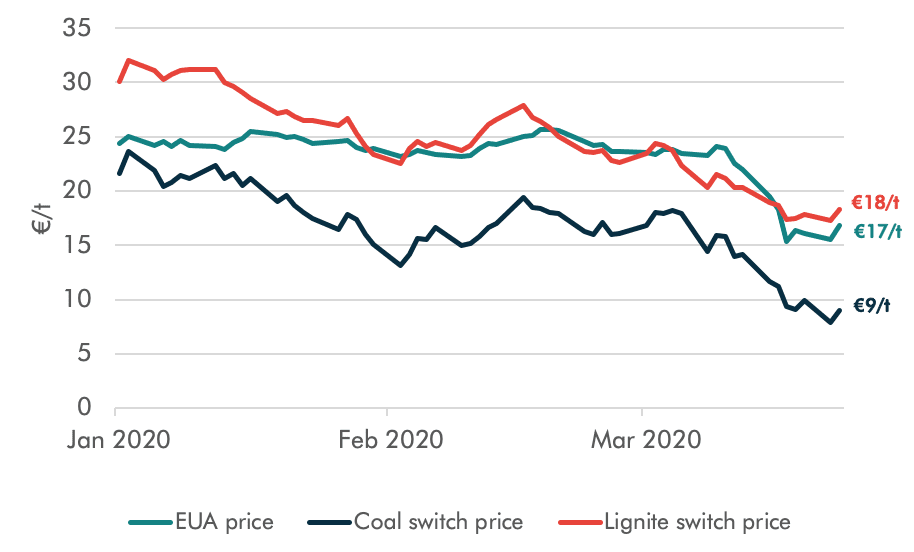
Source: Bloomberg LP data, Carbon Tracker analysis
Notes: Assumes 39% plant efficiency for hard coal, 36% for lignite and 49% for gas. The total fuel cost of lignite is estimated at €15/t. Front-year TTF gas, API coal and EUA are used. Carbon emission factors are from JRC-EU-TIMES.
Seize the opportunity
COVID-19 has rattled our economies, communities and energy systems. The financial disruption caused by COVID-19 is resulting in historically large stimulus packages to help those organisations and individuals most at risk. As governments implement these stimulus packages, they should not include additional coal capacity because its high cost compared to alternatives[xiii] and will further undermine the unit economics of the existing fleet. Indeed, the size of the stimulus packages provide policymakers with an opportunity to execute win-win solutions for the consumers, investors and communities. These solutions will be explored in future Carbon Tracker research published in May in collaboration with the Rocky Mountain Institute.
[i] https://www.bloomberg.com/news/articles/2020-03-23/coal-is-world-s-most-expensive-fuel-after-oil-s-brutal-collapse
[ii] https://www.bloomberg.com/news/articles/2020-03-27/one-corner-of-u-s-oil-market-has-already-seen-negative-prices
[iii] The API2 price assessment is the benchmark price reference for coal imported to northwest Europe. It is calculated as an average of the Argus cif ARA price assessment and the IHS McCloskey NW Europe Steam Coal marker. https://www.theice.com/products/243/API2-Rotterdam-Coal-Futures
[iv] https://ember-climate.org/project/coronavirus_electricity_demand/
[v] Based on BP statistics the biggest decline in coal generation occurred in 2015 (2.5%).
[vi] https://ieefa.org/global-coal-generation-fell-by-a-record-amount-in-2019-while-covid-19-may-cause-an-even-bigger-fall-in-2020/
[vii] https://endcoal.org/global-coal-plant-tracker/
[viii] https://www.gem.wiki/Impact_of_COVID-19_Pandemic_on_Major_Fossil_Fuel_Projects
[ix] https://carbontracker.org/reports/how-to-waste-over-half-a-trillion-dollars/
[x] https://cebr.com/reports/a-world-recession-is-now-almost-a-certainty-with-global-gdp-set-to-decline-twice-as-much-as-during-the-financial-crisis-the-challenge-now-is-to-prevent-the-recession-from-turning-into-a-1930s-style/
[xi] In 2017, the NDRC announced a memo outlining measures it would take to reduce volatility in domestic thermal coal prices. These measures aim to keep coal prices in a zone of Rmb500-575/t. Intervention is expected if prices go above Rmb600/t to manage generator margins and below Rmb470/t to manage miner margins.
[xii] https://www.euractiv.com/section/emissions-trading-scheme/news/eu-carbon-market-the-first-victim-as-electricity-demand-collapses/
[xiii] https://carbontracker.org/reports/how-to-waste-over-half-a-trillion-dollars/