


*This blog is written by Dwayne Purvis for Carbon Tracker*
The dynamics of unfunded plugging liabilities have changed so much over the years that investors and auditors are no longer using an appropriate financial lens to examine the threat. The conventional economic yardstick of present value makes asset retirement obligations appear artificially distant, and the resulting standardized myopia risk sets up a cash flow trap for operators and investors which can, in turn, ensnare regulators and taxpayers. To avoid the unrecognized risk, oil companies, their partners, and regulators should turn to a new financial measure, introduced here as “holdback.”
Regulatory back-step accumulated decades of unfunded abandonment liabilities
The catastrophic drop of oil price in 1986 seemed temporary, but under existing regulations temporary shut-ins threatened to trigger permanent abandonment of large numbers of wells. To preserve the option of reactivation longer, state regulatory agencies commonly modified their rules to allow for wells to be monitored – instead of plugged – after two years of inactivity. It, therefore, became common in financial calculations and planning to exclude the asset retirements obligations (AROs) such as well plugging. Costs were small, distant, and thus immaterial. Regulators’ indulgence of industry failed to foresee the obvious, if eventual, future.
Nearly 40 years later, the accumulated liabilities have become more than merely material. Carbon Tracker’s previous reports It’s Closing Time and Billion Dollar Orphans trace the outline of billions of dollars of exposure faced by oil companies and, ultimately, taxpayers. In Texas, for instance, the oil industry’s unfunded plugging liability is estimated to be about as large as the state’s annual budget, which is itself funded pivotally by severance tax on oil and gas production instead of a state income tax. A cyclical or secular turn in prices could simultaneously drive down state revenue, drive up its inherited liability, and then call upon taxpayers to clean up oil companies’ former profit centers.
Conventional financial yardsticks focus on the present, set up a future trap
Today, evaluators and investors are increasingly (and rightly but not universally) considering some form of AROs in their decisions. They typically schedule to pay the costs after the end of productive life as implied by current regulations, and they evaluate that plan using conventional financial tools, namely present value and rate of return. By design these financial yardsticks arrive at comparable values on today’s date by discounting end-of-life liabilities more than net revenues received sooner.
Though the conventional yardsticks are useful to get a perspective at the present time, discounting future events to a present perspective obscures events at the other end of the timeline. If cash flows simply dwindled to oblivion, then reducing future events this way might be sufficient. Instead, owners of oil and gas producing assets must come back out of pocket at the end of asset to fund still-growing AROs. Using present value sets up a cash flow trap. Thinning margins must pay for thickening liabilities, and funding AROs may require years or even decades of cash flow.
Present value yardstick obscure reality of upside-down “assets”
To demonstrate the end-of-life dynamics for an oil field, the table below characterizes the ability of a generic well to pay for plugging costs. The first columns on the left side assume the single well must pay only for its own costs. To the right in the table the columns show the effects of increasing proportions of idled wells within the same lease such that the last producer bears the responsibility of funding the plugging also of idled sibling wells.
The outlined column uses conventional yardsticks: the present value of net revenue is divided by the present value of the AROs. This analysis suggests that the liabilities outweigh the assets for the first time in last couple of years of productive life. Even six and seven years before the end of life, the liabilities seem to represent only about 20% of the value of the asset.
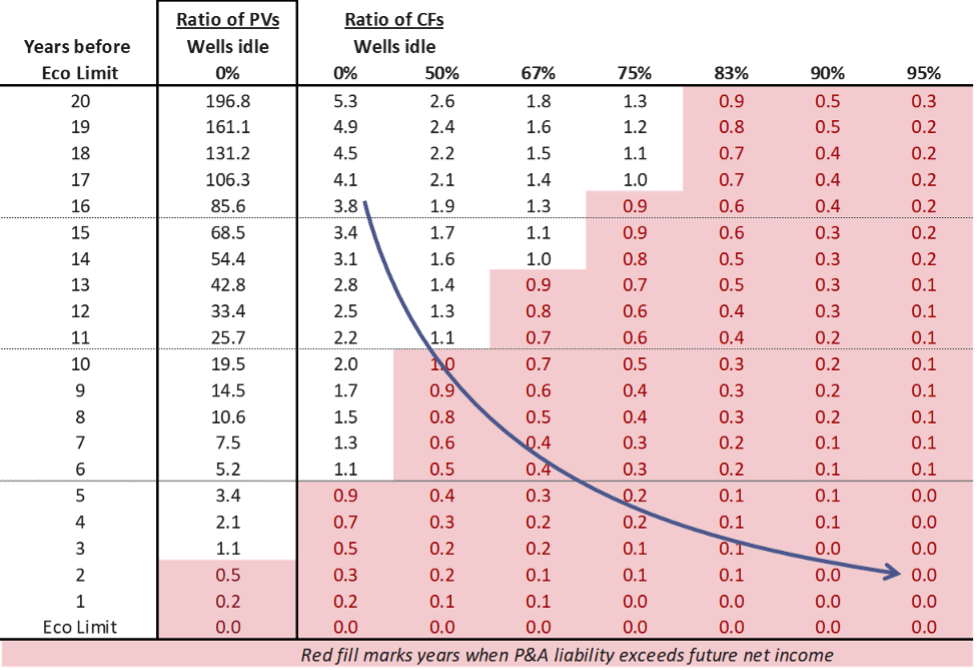
The next column, though, uncovers the same scenario by removing the present value myopia and comparing net revenue and AROs on an undiscounted basis. The property is, in fact, financially upside down on a cash basis about six years before its projected end, even while the present value still suggests the asset is secure.
Evaluators, investors, and auditors are right to look at present value to understand one aspect of the situation, but it is a simple matter of arithmetic to measure the same situation in a different way and to arrive at a non-pivotally different conclusion: Declining production and thinning margins mean that net present value can remain positive for years even after liabilities exceed total future profits.
Like this example, an operator plans by making forecasts of production, prices, and costs knowing that the reality of all three could turn out much higher or lower than they have assumed. If they analyze their projections using present value—as is universally the case—then they may think that they have many years before needing to worry about planning for retirement. However, it is possible that, while present value looks profitable, all forecasted profits would need instead to be saved in order to have the money available to pay its longer-term liabilities.
Cash flow inversion compounded by historical and ongoing accumulation
Subsequent columns to the right in the table show how the financial situation further decays as abandonment costs pile on. The fourth column in the table examples the situation of a late-life field in which already half of the unplugged wells have stopped producing. On a grand scale—though data reporting is incomplete and inconsistent—it appears approximately half of the unplugged onshore U.S. wells are already shut-in, and most producers qualify as late-life “marginal” or “stripper” wells. Anecdotally, I observe in practice many leases and fields where two-thirds or more of the unplugged wells are no longer producing in paying quantities. Those kinds of “assets” can face plugging liabilities equal to the profits of the last 10 or 20 years of production. Of course, if the profit projections do not hold up over that time frame, then the investors and public could still be called upon.
Onshore U.S. assets already stand mainly near the center of the table of scenarios. In the future – assuming operators continue their present course – passing time moves their assets downward in the table while warehousing more expired wells pushes the assets to the right, simultaneously biting from both sides to end up dramatically underfunded.
The trap and how to see it
This is the closing cash flow trap: the owner of a mature oil or gas field can look up to find themselves facing years of operations with little or no economic returns, little or no access to capital, and instead a risk of significant out-of-pocket liabilities. Worse for planning, the closing of the trap is not progressive and smooth as suggested by the table above. Inherent volatility in prices, production, and costs can trigger the trap sooner or later than expected. They might find that many years of remaining life still cannot fund their plugging liabilities.
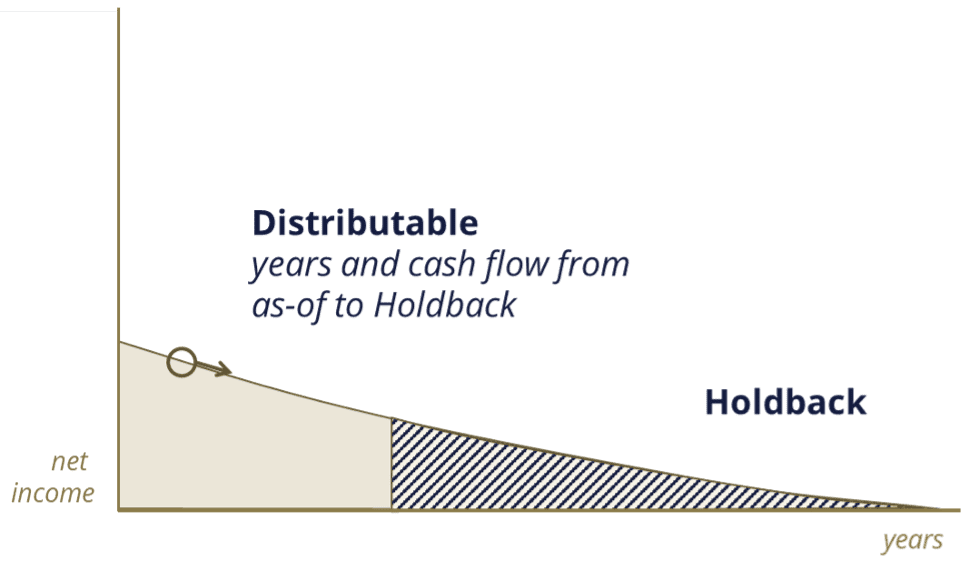
Whatever the route to dodge this trap, strategy formation begins by looking at the situation differently to see the threat: looking backward from the end of life rather than forward from the present. I propose a new yardstick called “holdback” resembling the yardstick of payout but in reverse: the number of years of undiscounted net revenue that would need to be “held back” to fund the undiscounted future capital.
In the mechanistic table above, the “holdback” period highlighted in red ranges from a few years to a couple of decades, and the figure below sketches the concepts graphically. The remaining time prior to the start of holdback can be called “distributable life,” as net revenue could be passed along to investors.
These yardsticks alone, however, do not address the inherent and differential uncertainties between net revenues and the relatively fixed liability it should cover. “Holdback coverage” can represent the ratio of undiscounted net revenues to undiscounted liabilities. These are the figures reported in most of the columns above. A holdback coverage of 1.25, for example, suggests that more than enough money is available, but it also shows that a 25% increase in the liability estimate or a 20% decrease in net revenue would reduce the owner’s expected distributable income to zero. Still one step further would examine net revenues discounted for risk divided by undiscounted liabilities.
What then?
The possibility of stranded liabilities threatens just about everyone in the value chain: operators, lenders, investors, auditors, regulators, and even the taxpaying public. Measuring holdback offers the foresight to avoid mortal financial risk in individual acquisitions, whole portfolios, and even broad basins.
For the executives and auditors who use the results of reserve and economic projections like those I prepare, measuring holdback begs a larger question: What does it mean for a business when projected cash flow over many years barely covers statutory liabilities? Or worse, what does it mean when projected cash flow already falls short of future liabilities?
For regulators and elected officials, the closing trap begs a meatier question: Should regulations change, or should taxpaying voters continue to shoulder the billion-dollar bet that companies will voluntarily take profits out of their pockets to put cement into the ground?
___________________________________
For more about the history, need, and application of holdback, please see the original white paper.