


The Bonding Data Set
Data sources
Bonding data was obtained either via freedom of information act requests or, in the case of Colorado, from the COGCC website. This data was collected between February and November of 2020.
Methodology
State-level bond estimates are the sum of the face value of all active bonds held by the state for the plugging of onshore wells, as of the date of the dataset used. The company-level bond estimates are the sum of the face value of all active bonds held by the state for that company for the plugging of onshore wells, as of the date of the dataset used.
The calculations exclude any blanket or other bonds held by the federal government and its agencies as well as any other form of financial assurance, including surety bonds.
For all states but Colorado, we have not aggregated parent/subsidiary relationships. In Colorado, given recent mergers and acquisitions, we have consolidated bonding data for Chevron and Noble under “Chevron” and Kerr McGee, Anadarko and Occidental bonding information under “Occidental.”
Operator company information is based on state nomenclature for all states except Alaska, where subsidiary holdings have been aggregated to the parent level.
Limitations
The names of individual companies are not standardized across state bonding datasets. Therefore, our database only allows searching of individual companies within a given state.
Bonding data does not appear to change significantly over short periods of time due to the fact that many companies utilize blanket bonds. Nevertheless, because bonding data is not regularly published by most states, the data may not reflect current conditions.
The database focuses on bonds held for plugging onshore wells and therefore excludes bonds companies hold for offshore wells and onshore facilities and surface activities.
We do not currently have plugging bond data for Texas.
Some states such as Ohio use other forms of financial assurance without quoted dollar amounts; these were not included in our calculations.
CA bonding data includes the offshore bonds of $ $8,500,000.
The Well Data Set
Data sources
We collected state well data, including total well counts, well status, production type, production activity and depth, from Enverus. Enverus was founded in 1999 as Drillinginfo, and now describes itself as “the energy industry’s leading data, insights, and software company.” We did not attempt to independently verify the accuracy or completeness of the Enverus data.
Methodology
We filtered well data by state, well status, and basin. We filtered by well status to remove plugged and undrilled wells that do not have an outstanding plugging obligation. We therefore excluded wells classified as:
- cancelled (wells where the permit was cancelled prior to any physical work),
- expired permit (wells where the latest permit has expired prior to any physical work),
- permitted (authorized wells yet to be drilled), and
- P&A (wells previously plugged and abandoned).
We also filtered wells by basin to exclude offshore wells in state waters in the Pacific Ocean and Gulf of Mexico. Accordingly, our estimates account for onshore wells only.
Because all oilfield wells, regardless of purpose, must be plugged and abandoned according to state law,[1] we included wells with all production type classifications, including oil, gas, oil and gas, coalbed methane, injection, disposal, dry hole, monitor, storage, unknown, and water. Our well counts are therefore higher than those reported by some state regulators that account only for wells drilled to produce hydrocarbons.
We subdivide the state well count and closure cost totals into five categories to provide a rough screen for orphan well liability risk. The five categories described below are mutually exclusive and holistic in that they account for 100% of each state’s reported wells.
- Producing – Unplugged wells with a Last Production (LP) date within the past two years and average daily oil and gas production equal to or greater than 15 barrels of oil or 90 Mcf of natural gas.
- Stripper – Unplugged wells with a LP date within the past two years and average daily oil and gas production less than 15 barrels of oil or 90 Mcf of natural gas.
- Injection + other – Unplugged injection wells and other unplugged wells with no reported oil and gas production, including wells classified as disposal, dry hole, monitor, observation, other, storage, and water.
- TA (LP>2460) – Unplugged wells with a LP date between 2 and 5 years.
- Zombie (LP>60) – Unplugged wells with a LP date more than five years ago
Well Counts
Our well counts include unplugged onshore wells of “unknown” production type. Nationally, Enverus reports 483,000 such wells. Many of these appear to have come from older databases, including the PennWells database, that in some cases pre-date State-level tracking of wells. The operating status is inactive or unknown for three-quarters of these wells. Almost all have location data, but only 20 percent have depth information. Two-thirds have a reported operator. However, we have not sought to determine whether the listed operators are existing entities. We have observed that well counts may for each state may fluctuate overtime, sometimes substantially, and this may reflect uncertainty around the plugging status of historic wells, among other things.
Although excluded from our well counts, Enverus lists 93,000 plugged wells of “unknown” production type, two-thirds of which are located in Oklahoma and West Virginia. We suspect but cannot confirm that these are legacy wells plugged by state orphan well programs.
Cost Estimation
As reported in It’s Closing Time, estimates of plugging costs are often in the tens of thousands of dollars. in this range are commonly reported by oil companies and data providers: Diversified Gas & Oil—$28,400 per well;[2] and Rystad—$20,000 to $40,000 per well.[3] In our view, such estimates are misguided because they fail to account for the fact that plugging costs, like drilling costs, increase with depth. However, this can be thought of as a “proxy” or baseline assessment of p&a costs by some in industry.
Our cost estimates are based on True Vertical Depth (TVD), which Enverus defines as the “total true vertical depth of intended bottom hole measured in feet,” using a depth-based exponential cost function. TVD is available for some wells and not for others. For onshore wells with a TVD measurement, we estimated the closure cost for each well by applying a depth-based cost function derived from the Australian P&A completion cost data described in our prior report and illustrated in Figure 2 below. Notwithstanding publicly available data showing that ultra-deep wells can cost over a million dollars to plug, we conservatively capped our per well cost estimates for such wells at the modeled cost to close a 10,000-foot well, approximately $300,000.
Australian P&A completion costs by depth
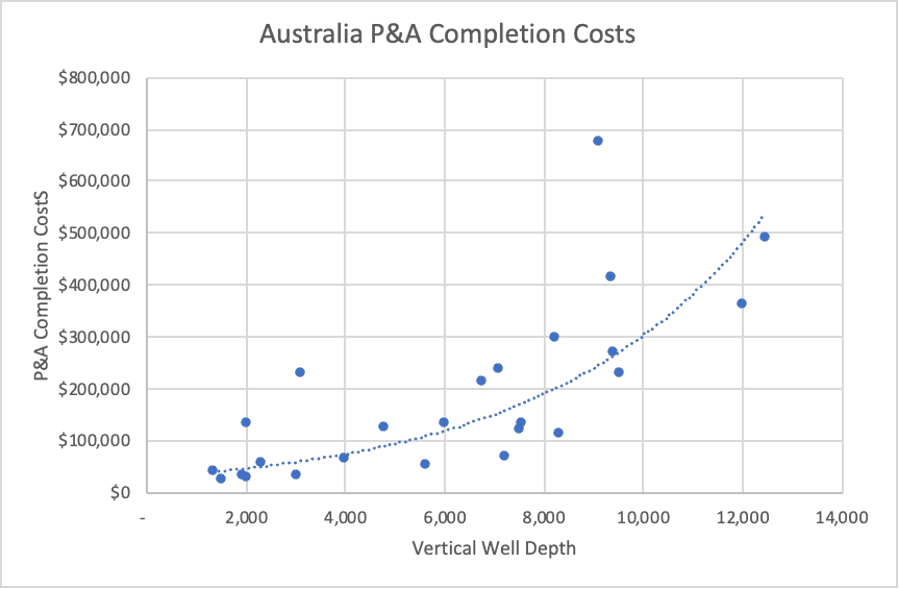
We estimated the closure cost for onshore wells with no-TVD measurement based on the estimated cost (using the same cost model described above) to close a well having the average TVD of those wells within each state having a TVD measurement. For example, the average depth of onshore wells in California with TVD measurements is 2,800 feet. Our cost estimate for wells of this depth is $59,000, and we applied this cost to all onshore wells in California having no TVD measurement. This estimate is conservative when compared to the findings of a recent report from the California Council on Science and Technology (CCST), which estimated the cost to close onshore wells in the state at $68,000.[4]
After calculating an estimated closure cost for each unplugged well, we summed the individual cost estimates to produce a total closure cost estimate for each oil producing state.
Limitations
Unknown well depth
Our model generates cost estimates based on total vertical depth (TVD) of well. Where only some wells in a given set have associated depth information, the model takes the average TVD for those wells and applies that to wells in the set with no depth information. For states or operators where there is no TVD data, the model does not calculate a liability cost estimate.
Because the average depth is dependent upon the search set, this can yield different cost estimates for the same wells. For example, if the TVD average for all wells in a state is lower than the TVD of all wells owned by a particular company, our model will apply the lower TVD average when searching for all wells in the state and the higher TVD average when searching for that company. This may result in slight differences in cost estimates when searching state-wide or individual companies in a state.
Most wells listed with “unknown” production type lack well depth information. We suspect these are legacy wells that are likely to be shallower, on average, than newer wells. If this is the case, our cost estimates to plug these wells, based on the average depth of wells having depth data, may be overstated. On the other hand, we make no adjustment for the age or potential degradation of aged wells, though that may increase actual costs.
Well counts
Enverus’ unplugged onshore well counts may be significantly higher or lower than the figures listed on state databases. There are several reasons for this. Enverus collects a lot of its well data from the state and local governments that regulate the industry, but it also collects well data from other sources.[5]
Also, states may omit some well types from their published data. For example, the Railroad Commission of Texas reported a total of 439,695 oil and gas wells in the state, as of July 30, 2020.[6] By comparison, around that time Enverus listed 444,000 wells classified as either “oil” or “gas”. Enverus also listed 32,000 wells classified as “oil & gas”, in addition to another 130,000 non-production wells (e.g., injection, disposal, and water wells), and 187,000 wells of unknown production type. In total, Enverus counted 783,000 unplugged wells in the Texas onshore oilfields. As of end of January 2021, Enverus’ well counts for Texas have been revised downwards substantially.
In another example, Enverus counts 73,000 unplugged wells in New Mexico, whereas the State of New Mexico reports only 66,000 wells.[7] The difference appears to be nearly 7,000 wells of unknown production type included in the Enverus database but excluded from the state’s database. Almost all are inactive wells located in the San Juan basin.
Also, our well counts may vary from state well counts due to misclassification of well status (i.e., unplugged wells may be misclassified as plugged), data update cycles, or other reasons unknown to us.
Cost estimates
Our cost estimates are subject to significant estimation uncertainty. Actual well closure costs may be higher or lower.
Our cost estimates are based on industry P&A completion cost data and therefore implicitly assume that oil and gas companies will fulfill their legal obligation to retire producing and idle wells in the ordinary course of operations. In the event that wells are orphaned, the cost to perform the same work by a state may be significantly lower due to greater timing flexibility. See It’s Closing Time. We have not considered whether that would remain the case if workover rigs for closures were in high demand, or other changes due to an uptick in plugging activity.
Our estimates, which are based on a P&A completion cost model, do not reflect the full range of potential costs to retire existing onshore wells and largely exclude well-specific factors other than depth, such as reclamation costs, well bore damage, and proximity to human populations and sensitive receptors. Reclamation costs can be high. For example, North Dakota reclaimed two orphaned sites in 2018 for a total cost of $862,338.[8] And the Director of the North Dakota Industrial Commission’s Oil and Gas Division, Lynn Helms, estimates that they will incur reclamation costs at up to 40% of the sites they close.[9]
Our estimates do not include costs to decommission, plug and abandon offshore wells in state or federal waters.
Our estimates exclude adjustments for future inflation and the time value of money and do not consider state-specific well closure standards that could impact well closure costs.
Our estimates may not include all unplugged onshore oil and gas wells in the U.S. The U.S. Environmental Protection Agency (EPA) estimates that 1.15 million abandoned wells in the U.S. are not captured in the Enverus database.[10] Costs to close these wells are not included in our state cost estimates.
Offshore liabilities
Our cost model is focused solely onshore. Therefore, it understates liability at state and company level where the state or company has significant potential offshore liability. This includes states such as California, Texas, and Louisiana. The omission of this information could be significant and represent multiples of the onshore liability identified in our database.
Return to the ARO Portal homepage
[1] See e.g., Texas Rule 3.16 (Log and Completion or Plugging Report), which defines “wells” subject to reporting and plugging requirements under Rule 3.14 as “A well drilled for any purpose related to exploration for or production or storage of oil or gas or geothermal resources, including a well drilled for injection of fluids to enhance hydrocarbon recovery, disposal of produced fluids, disposal of waste from exploration or production activity, or brine mining.”
[2] See 2019 Diversified Gas & Oil investor presentation at: https://d1io3yog0oux5.cloudfront.net/_28d9d5529099b5877b9e19aa9798c2da/dgoc/db/557/4323/pdf/DGO+-+Investor+Presentation+-+June+2019_vFinal_updated+slide+13.pdf.
[3] https://www.rystadenergy.com/newsevents/news/press-releases/american-backyard-wells-the-flexible-11pct-of-the-us-onshore-oil-output-now-face-an-inflexible-choice.
[4] (See Finding 3-6: “Based on a small sample of well-level plugging costs, the statewide average cost to plug and abandon an onshore orphan well is $68,000.”). https://ccst.us/wp-content/uploads/CCST-Orphan-Wells-in-California-An-Initial-Assessment.pdf.
[5] https://www.enverus.com/tag/oil-and-gas-data.
[6] https://www.rrc.state.tx.us/media/59240/wells-monitored-july-2020.pdf.
[7] https://wwwapps.emnrd.state.nm.us/ocd/ocdpermitting/Data/Wells.aspx.
[8] https://www.nd.gov/auditor/sites/www/files/documents/Reports/State/2018%20Industrial%20Commission.pdf.
[9] Director, Lynn Helms, Oil and Gas Division, Department of Mineral Resources, North Dakota Industrial Commission. Oil and Gas Division Three-Part Education Series: Well Plugging and Reclamation, 2020. https://www.dmr.nd.gov/oilgas/pressreleases/Part_3_Reclamation.pdf
[10] https://www.epa.gov/sites/production/files/2018-04/documents/ghgemissions_abandoned_wells.pdf.