


One of last year’s key developments relating to climate change risks was a handful of fossil fuel producers agreeing to show how each “new material capex investment” was consistent with the Paris goals, a success of the CA100+ investor engagement initiative. Once a resolution is passed at an AGM, it becomes legally binding. BP has now published its 2019 annual report, including its first iteration of the required analysis.
We think that the concept of testing each capex decision for compliance with Paris is sound. However, as we had flagged, the devil is in the detail, and will increasingly be so as the climate discussion moves deeper. We find some positives in BP’s approach, but also shortcomings.
How do companies interpret “Paris goals” for testing consistency…
For the purposes of evaluating consistency with the Paris goals, BP tests its 2019 investments using a price assumption which corresponds with a “sustained low-price environment”. It notes that, “price assumptions do not correspond to a single specific ‘Paris-consistent’ scenario, but instead place weight on a range of possibilities for how the demand for different forms of energy may change in Paris-consistent pathways and how this may affect future energy prices”, and is informed by a range of third party scenarios that “claim to be consistent with meeting the Paris goals”[1].
Accordingly, it could be argued that BP testing its investments against a flat price that happens to correspond to its own lower price case scenario – rather than the test being linked directly to the Paris goals through a carbon budget or demand pathway – isn’t doing quite what was stipulated by the resolution. It could also be argued that the third-party scenarios used to inform the analysis are more likely to be closer to the “well below 2 degrees” limit of the Paris Agreement, instead of the goal of 1.5 degrees.
The challenge facing companies seeking to perform analysis of their portfolio resilience is that of translating future climate outcomes into drivers of value to calculate economic outcomes. Even if we assume that we know future demand with certainty, commodity prices are fiendishly difficult to predict.
The job of scenario analysis is therefore generally to do something reasonable and conservative that reassures stakeholders that risks are being taken seriously. While long-term estimates do not attempt to incorporate short-term volatility, events may quickly make them look out of date as we have seen repeatedly in recent history.
… and then convert them into commodity prices?
The price assumptions used by BP are cited as a flat $50 per barrel for Brent oil and $2/mmBtu for US gas. For some undisclosed reason, these prices are quoted in 2015 dollars – illustratively assuming five years of 2% inflation brings the oil price up to around $55 in today’s money.
These price assumptions are therefore slightly lower than those in the commonly-used Sustainable Development Scenario (SDS), published by the International Energy Agency (IEA), which assumes $62 in 2025 and $59 in 2040 (in 2018 dollars).
BP notes that falling demand and abundant resources would lead to an “increasingly competitive” market for oil, as recent events have illustrated with a vengeance. However, they expect that impacts on price are tempered by the “dependence of many oil-producing economies on oil revenues to support their wider economies”, noting that “the IMF estimate that the fiscal break-even prices of the major Middle East and North African oil exporters is close to $80”.
BP’s price assumption is only slightly lower than prices over the last 5 years (which average $61 in real terms), a period when non-OPEC supply has grown steadily. We are unconvinced that major exporters would be willing and able to consistently cut production on a co-ordinated basis in a world where oil demand was falling every year, continually lowering their market share over time to the benefit of others.
Further, it could be argued that if this is a price level that still encourages production growth (even if that production growth doesn’t create a lot of value), it isn’t a terribly conservative proxy for a world where production must fall on a sustained basis to meet the Paris goals.
But again, we can only speculate about the future, especially given the current turbulence. Stakeholders will need to satisfy themselves that they are comfortable with this price assumption.
Profitability index – a useful metric as a first step
BP gives the results of its analysis in terms of profitability index, which is calculated as (present value of future cashflows excluding initial investment)/(initial investment) or equivalently (NPV of future cashflows including initial investment)/(initial investment) + 1. In other words, it shows whether the economic benefits of a project outweigh the costs.
A profitability index of 1.0x therefore indicates that an investment breaks even but creates no value; above 1.0x indicates value creation, below indicates value destruction. BP notes that “As a guide, we would normally target a minimum threshold of greater than 1.0x on this basis” which hopefully goes without saying.
Profitability index is therefore a useful benchmark of project value creation. However, as always, the interpretation and underlying assumptions warrant scrutiny.
Sanction decisions must be reviewed individually, not in average
BP indicates that the capex-weighted average profitability index of its 2019 investments was 1.5x – we consider this average irrelevant for the purposes of the Paris consistency test, which requires that each new investment pass the test, not the portfolio be consistent on average. If an average were used, every oil company could sanction a mixture of Paris-consistent and inconsistent projects, being consistent with Paris on average, but with the planet failing the Paris goals in total. Clearly, just looking at the average would therefore be against both the letter and the spirit of the resolution, and we must look at each sanction decision individually.
The results for the individual projects are not provided in detail. However, looking at the weakest project on the chart, we can see that it is incredibly close to the 1.0x line – the trusty ruler and eyeball suggests a profitability index of approximately 1.05x at the assumed oil price, or an NPV only very slightly above 0.
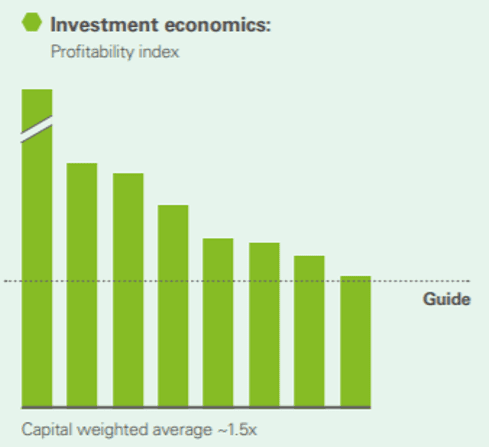
Source: BP
This is then where assumptions become critically important. The project passes the test (as BP defines it) by a whisker – it appears that any lower a price assumption, or any higher a discount rate, and it would have failed.
Accordingly, a sensitivity analysis would be valuable to give context for outcomes at different prices, in case readers have different price expectations. A project may be acceptable with a profitability index of only slightly above 1.0x at $55 if it has limited downside below that, whereas a project with a higher profitability index may be more concerning if its value is quickly wiped out by a small shift in prices. Similarly, it would be useful to understand whether these estimates assume that project development goes according to plan without delays or cost overruns, or whether they incorporate any contingency.
What level of returns will be required in the new world?
Further on the point of transparency, BP does not disclose the discount rate/rate of return used in the NPVs for this calculation. It notes elsewhere that its weighted average cost of capital (WACC), used for NPV calculations for impairment purposes, is 6% (post-tax) – this seems a likely starting point.
In theory, a WACC is absolute – however, in reality, changing markets result in changes in financing costs. Ultimately it is up to investors to decide what rate of return they require, and that will depend on the risk profile of the investment. A solar project may be attractive with an 8% yield, a government bond even if its yield is negative. But what about fossil fuel developments, and how might that change in future?
BP may be comfortable with an oil project that goes according to plan delivering a 6% return; an investor who is concerned about transition risks may want a higher reward. Again, a sensitivity might be useful – how would it look if the projects had to deliver say 10% returns?
Cross-checking with Carbon Tracker – at least one of BP’s projects looks challenged
In our 2019 report “Breaking the Habit”, we performed an analysis of recent sanction decisions to determine which fell outside a climate-constrained demand outcome. Our analysis used the fundamentals of demand under the IEA SDS and the relative costs of available supply options to determine which projects fit within that scenario or not, assuming that the lowest cost projects are those that go ahead. This therefore creates an internally-consistent view of which projects fit within a particular climate constraint, and ensures that constraint is not breached. This contrasts with the use of an exogenous oil price assumption, which does not guarantee an “apples with apples” comparison between the assumptions underlying the price and the tested projects, and which does not necessarily constrain demand/supply to Paris-consistent levels given the many factors that affect the oil price.
In that analysis, we estimated that an oil project must generate a 15% internal rate of return (IRR) at an oil price in the late-$40s to be competitive under the IEA’s SDS demand levels (which the IEA considers as equating to an outcome of a 50% chance of limiting warming to 1.7-1.8 degrees), based on today’s estimates of industry cost structures and supply options.
Our use of a 15% discount rate bakes in a contingency and indicates that a project must generate a minimum level of return for sanction. As a result, the prices cited are not directly comparable with BP’s, where an assumed 6% discount rate reflects cost of capital and therefore only requires that a project break even rather than create value.
In our report, we highlighted projects sanctioned in 2019 that failed to fit within SDS demand levels by at least a $10 margin of safety – in other words, those that required a price in the late-$50s or above to deliver a 15% return and fell hence outside our cut-off by a distance. We highlighted BP’s Azeri Central East (ACE) project as being in this category, i.e. failing to be competitive under an arguably fairly generously-defined Paris compliance test.
BP does not give the name of the project associated with each profitability index rating, or even if it is oil, gas or downstream. BP’s weakest project appears to deliver a return close to 6% in the mid-$50s. Perhaps that one is ACE, perhaps not. Either way, ACE passes BP’s test but fails ours.
How consistent is “consistent”?
As the debate progresses and companies face increasing pressure to justify their investment plans in the face of climate-related concerns, all parties will have to go further into the weeds on detail. We have noted the grey areas around projecting what commodity prices might look like under conditions of weak or falling demand.
A further issue goes to the definition of the test itself. BP was asked to show that its investments were “consistent” with the Paris goals, rather than “aligned” for example. But what does “consistent” mean in this case? It is open to interpretation. BP appear to take it as meaning that a project would not destroy value in its Paris-proxy price case. Others might note this means that in order for the project to create meaningful value, prices would have to be above that – implying higher levels of fossil fuel demand and a higher global warming outcome. Whether a project sanctioned on the assumption of the failure of the Paris goals can be called “consistent” with Paris is in the eye of the beholder. BP’s annual report was released on the same day as BP’s net zero ambition, and presumably drafted a fair way beforehand. With BP’s recognition of the limited carbon budget and intent to transform itself, perhaps BP’s own interpretation will change over time.
As the discussion gets more sophisticated, it moves into an interesting new phase. We commend both the CA100+ for proposing the resolution, and BP for supporting it. Now stakeholders will have to spend the time working through what it would truly take to put their minds at rest.
[1] “To aid this analysis, we consider a range of scenarios which claim to be consistent with meeting the Paris goals including: IEA’s ‘Sustainable Development Scenario’, BEIS’ ‘Low Prices’ case, Aurora Energy Research’s ‘Two degrees’ scenario and MIT’s ‘Paris to 2°C’ scenario.” BP, Annual Report and Form 20-F 2019