


Download Infographic Here
The energy transition may well be determined by the phenomenon of S-curves. This is because the future energy system will be characterised by manufacturing technology, not extractive fossil fuel projects.
The S-curve is a well-established phenomenon where a successful new technology reaches a certain catalytic tipping point (typically 5-10% market share), and then rapidly reaches a high market share (i.e. 50%+) within just a couple more years once past this tipping point.
Manufacturing technologies improve quickly by S-curves, scalable learning-by-doing techniques based on thousands and thousands of repeated parts and assembly.
Extraction projects are almost the opposite: one-off large scale complex efforts that are difficult, potentially impossible, to replicate and improve.
The S-Curve of manufacturing represents the slow initial adoption of a new technology or innovation, followed by a period of rapid adoption and, later, a levelling-off as the technology or innovation becomes mature and reaches market domination (hence the ‘S’).
Many successful technologies tend to take-off spectacularly, on reaching a market share of 5-10%, to oust the incumbent technologies.
Behind every successful S-Curve there has to be a successful learning curve. In a virtuous cycle, the successful technology will get cheaper the more it gets deployed and will get more deployed the cheaper it gets.
When applied to our energy industry analysis, we find the following:
Solar panels, wind turbines, and lithium-ion batteries have all followed such learning curves. Each technology has declined in cost by over 90% in the past two decades. And so their growth has followed an S-curve model.
And now that they are deployed at global scale, this theoretical insight has major real-world energy implications: wind and solar power generation is now 12% of the global total from less than 1% a decade ago, growing at 20% per year.
Thus S-Curves by their nature are disruptive and rapid. An energy transition driven by S-Curve technologies is unlikely to be smooth. As the adage goes: gradually, then suddenly.
This is even more important in the context of a primary energy system that is essentially flat, growing at a rate of about 1% per annum. When a new energy technology enters at a high rate of growth, the incumbent technology will eventually have to exit at a high rate too.
The benefits of S-Curve technologies are fairly obvious. Not only do they help sectors such as power and transport to align with the targets of the Paris Agreement, they also bring about major environmental and economic benefits to energy users.
As for S-Curves themselves, one of the key advantages of using them in energy forecasting is that they capture the non-linear nature of technology adoption and diffusion.
This is particularly useful in situations where the rate of adoption is influenced by a range of factors, such as the availability of financing, regulatory incentives, and consumer preferences.
As the energy system transitions towards deploying solar, wind, and electric vehicles (EVs) on a large scale, reducing its reliance on technologies extracting fossil fuels, the impact of learning rates and S-Curves will become significant tools to use, predict, and analyse the shape of future energy changes in various major sectors.
A good recent summary of such an impact in the energy industry is provided here by INET at Oxford University.
In addition, and highlighted below, we have several more detailed examples of the S-Curve effect in the energy transition covered by Carbon Tracker’s analysis in recent notes.
In two papers we released in December 2022 and January 2023 as part of our automotive coverage, Slipped Gear and a joint blog with automotive think tank, New Automotive, we covered the rapid change of the global automotive industry structure, due to the sudden emergence of battery electric vehicles (BEVs) at industrial scale.
This sudden arrival is due to several factors, but two stand out: the scalability of BEV batteries driving down their costs by 90% over the past 15 years, and the recognition that transport stubbornly contributes 20% to global emissions. So just as BEVs become affordable, they also become a major policy tool to achieve Paris targets: hence they feature in many government policy targets, for example, the UK 2035 ICE ban, and the US Inflation Reduction Act.
We say sudden arrival because as recently as 2016, global sales of BEVs had failed to reach the one million mark, and were less than 1% of global sales,
In 2022, however, just six years later, we expect global sales to be over 10.3 million and have 13% market share, at a growth rate of 50% pa that looks set to continue. Assuming it does, then 2023 will show sales of about 14 million and reach a market share of close to 20%.
This high growth rate of BEVs would not be a major problem for incumbent automakers if all car sales were growing quickly: fossil-fuelled ones as well as BEVs. But they are not. Global car sales have been largely flat for the past decade.
In theory this means that any increase in new BEV sales decreases the sales of any new fossil-fuel car: and that is what has happened in the global car market, at an increasingly rapid rate: the peak in sales of fossil fuel cars was likely 2016-17 globally. How fast sales decline from now on is therefore of huge importance to the industry.
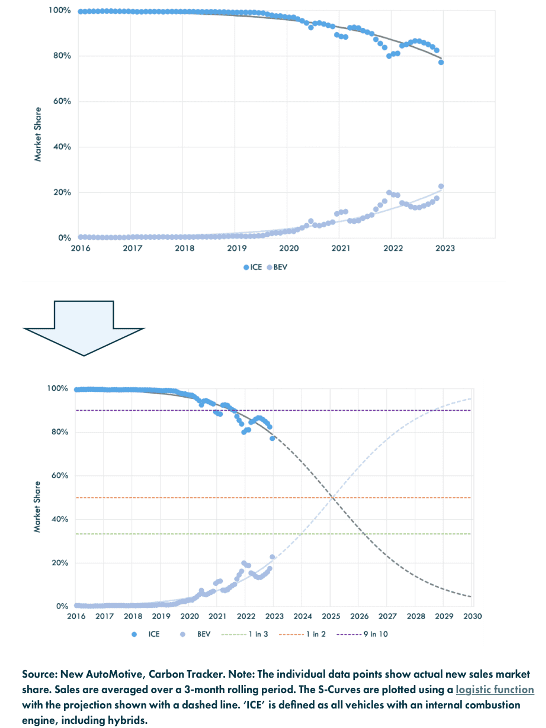
In our blog we researched the UK car market in detail to see how the shape of new BEV sales followed this likely trend. The chart below shows a classic S-curve outcome, with actual sales up to 2022 in the top chart, and projected sales to 2030 in the bottom chart.
As noted in the blog post this means: “In 2016, UK BEV sales were less than one in a 100; by the end of 2023, one in three new cars registered in the UK could be fully electric.”
And the main finding this trajectory takes you to is that by 2030 sales of fossil cars in the UK could be a small minority of the total: less than 10%. If that sounds far-fetched consider that in the UK in 2017 pure diesel and petrol car sales were 98% of the market — today they are 50%.
Figure 1: UK New Vehicle Sales – BEV and ICE Market Share – Adoption S-Curves
In theory, incumbent fossil fuel OEMs (original engine manufacturers, companies like Ford, BMW, Toyota and so on), should be able to adapt to this new market terrain, and just electrify their best-selling brands.
But as the report Slipped Gear shows, they have been stalling in this mission for a variety of reasons, mainly:
- Prioritising Legacy Profits: Automotive OEMs hooked on ICE vehicle profits neglect improved emissions reduction and investment in BEV technology
- Poor signposting: Automotive OEMs have weak interim emissions targets, which are not aligned to meeting climate goals
- Lack of transparent financial alignment with the Paris Agreement – incumbent firms are reluctant to be transparent about their legacy fossil fuel vehicle liabilities and slow to embrace the new green revenues from BEVs
As a result, this has allowed the rapidly growing BEV market to be quickly flooded with new entrants who have no legacy fossil fuel vehicles or culture – most notably Tesla, but increasingly by new start-ups and Chinese firms venturing outside China, initially in JVs, and now also as stand-alone brands such as SAIC and BYD.
Meanwhile incumbents attempt to use policy tools to slow change: but as the S-curve logic applies, when the benefits of the learning curve of costs kick-in, and BEVs start to become ever cheaper, the change will likely be only one way, and very quick. The rising cost of fossil-based automotive fuels, petrol and diesel, in the past two years will only make this transition ever slicker.
What this means for incumbent automakers, and indeed the oil industry whose monopoly position on fuelling cars is now being superseded by electrons will be part of a Carbon Tracker Automotive blog series. At current rates of growth, for example, the global passenger car fleet could be 20% BEV by 2030, removing a whopping 4-6mb/d of oil demand.
Meanwhile recent company assessment of global lead automakers can be analysed in depth here, along with assessments of oil and gas and utility firms.
In the Energy Transition more generally, as noted, the power of S-curves goes well beyond BEVs. As we detailed in our last Energy Monitor issue in December 2022, African Sun, and in the 2021 report The Sky’s the Limit the learning curves of utility scale solar PV panels has made solar electricity in many cases the cheapest in the world.
So much so it is estimated that 1,100GW of solar will have been installed by end 2022, including 30% pa growth last year of 258GW, maintaining the growth rate of the past 12 years since 2010 – a 20-fold increase overall. See here.
In 2022, solar and its high-growth fellow traveller wind power accounted for over 12% of global electricity generation, growing together at 20% per annum. Only a decade ago the two technologies formed about 1% of global generation.
The power of S-curve growth means that wind and solar now account for over 75% of all annual growth in the power sector and will likely account for all of it in the next 2-3 years, forcing out fossil fuels at an increasing rate.
Solar and wind installed capacity of over 2,000GW in 2022 is higher than global coal capacity – and although generation will lag coal for a few years, with sustained high S-curve growth rates, this target will also likely soon be in reach.
In addition, as noted in our report on clean hydrogen for hard-to-abate sectors, innovations in electrolyser technologies are causing rapid price decreases and therefore a new S curve potentially for “green” hydrogen sourced from emission-free electricity. Heat pumps for electrified space heating are also starting to show signs of S curve characteristics at scale.
We have also delved into a major energy transition report reviewing 2022’s high growth in renewable energies – again with S-curves being a major factor.
The IEA released its annual World Energy Outlook (WEO) late last year. It is a (very) long detailed document, used by many energy stakeholders such as governments and international corporations.
In our summary review — On Track for Paris? IEA lays out required pace of energy transition to keep 1.5°C in sight we extracted the following key messages:
- In its most recent World Energy Outlook, the IEA describes a rapidly changing energy landscape; the invasion of Ukraine has revealed the fragility of the fossil-fuel based energy system and hastened the energy transition.
- Electrification, which feeds off and into large-scale deployment of renewable technology, will be key to the shift to clean energy.
- With scenarios updated, the IEA sees peaks or plateaux for all fossil fuels, even with business as usual, before 2050.
- The IEA’s 1.5°C scenario now includes a greater degree of temperature overshoot, and relies heavily on the rapid deployment of emissions mitigations technologies before 2050.
- A more credible – and cheaper – pathway to 1.5°C may be possible, with more trust in renewable growth and faster wind-down of fossil production.
Again – the power of S-curves is clearly seen driving the energy transition.
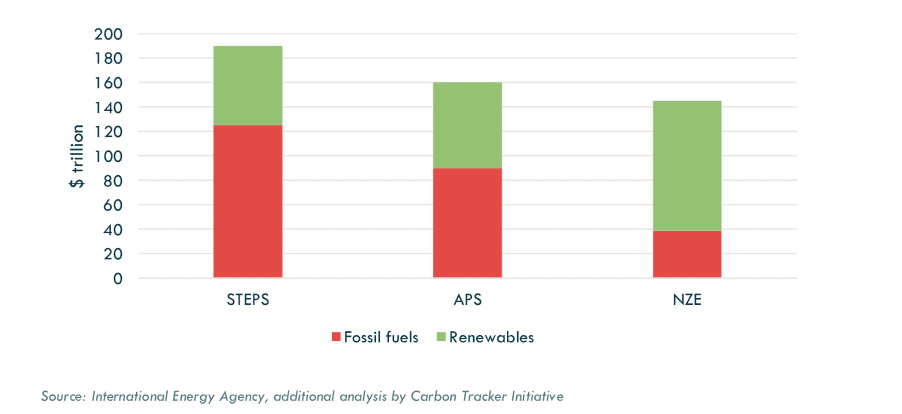
Even venerable organisations such as the IEA may well get so much wrong by so little a mathematical error in predicting the rapid growth of manufacturing energy.
Figure 2: Total Energy Cost to 2050 by Scenario
Indeed, to confirm this rapid growth trend, other major analyst groups such as the UN sponsored Inevitable Policy Response forecasting unit have just released a new report on the Race to the Top emerging between China, the EU and US as they each aim to grasp the opportunities for re-building the global energy system using clean technologies compatible with global climate goals – and accelerate the shift.
It goes without saying that to replace a global energy system that produces over 35 billion tonnes of CO2 per annum, a very big and more efficient system needs to quickly step in to supersede it. This report shows how that could be done.
Yet, despite all this new energy at speed and scale, across several sectors, incumbent fossil fuel companies continue to increase their investment in out-dated energy production, and so rapidly increase their risk of stranding their uneconomic energy assets.
Despite the rapid increase of energy alternatives in power and transport, and predictions of peak oil demand in the near-term, even in the most conservative scenarios, for example, the IEA’s WEO STEPS, our Paris Maligned report highlights that major oil and gas companies are continuing to ever expand investment and production.
The report notes:
- Asset owners seeking 1.5°C-aligned portfolios cannot credibly own financial interests in companies that continue to invest in new conventional oil and gas projects. Alignment with Paris – whether 1.5°C or ‘well below 2°C’ – implies production declines by 2030, yet most oil & gas companies are planning production increases.
- With Russia’s invasion of Ukraine pushing commodity prices higher and incentivising new investment, investors looking to be Paris-aligned must continue to scrutinise company plans, as investment in new oil & gas projects that lock-in future emissions are incompatible with Paris.
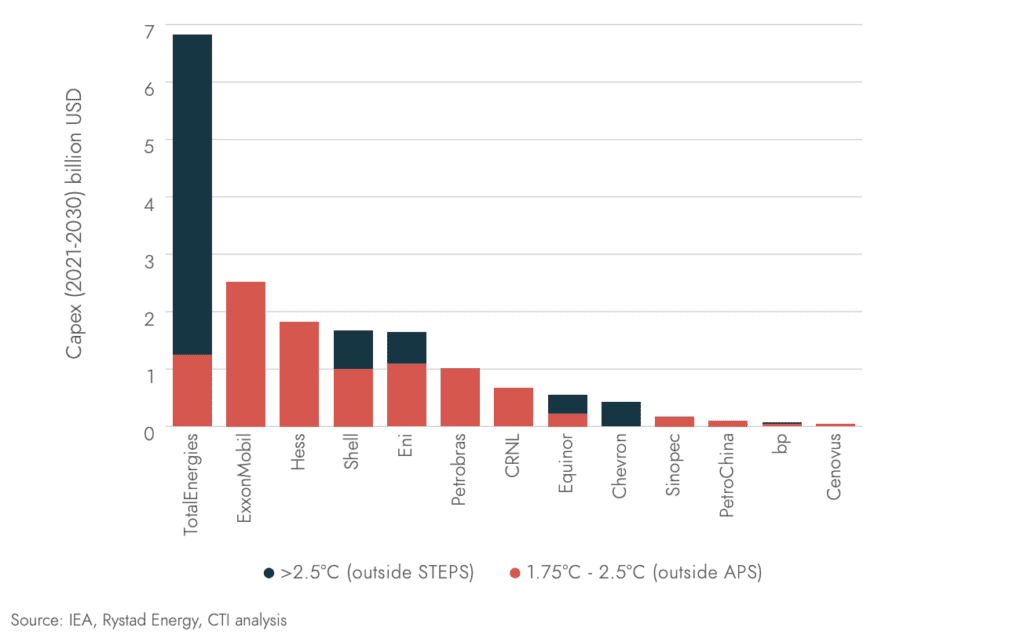
- 62% of investments approved in 2021/Q1 2022 (or $103bn) were inconsistent with a Paris-aligned pathway (the IEA’s 1.7°C Announced Pledges Scenario), including $58bn that was outside even a 2.5°C outcome.
This is not just bad planning, or bad environmental governance it is high risk economics with investor money, given the speed of new entrant alternative energy technologies.
Figure 3: Investments approved in 2021/early 2022 that are not Paris-aligned
Drilling Down into oil and gas prices used in financial reporting
“Financial statements, like economic models, are only as good as the inputs to them.”
In a comprehensive note published last year, Still Flying Blind, we highlighted how a large number of major oil and gas firms insulate themselves from the world at large in their opaque financial statements which still mostly put the risks of the energy transition and climate change at a distance from their own balance sheets.
Our new Drilling Down report looks into this in more detail for major UK and EU Oil and gas companies. We analysed the disclosures made by them, with particular attention to the projected oil prices that they use to test their productive assets for impairment.
As the world energy system is rapidly shifting around them fossil fuel companies are using nothing more subtle than assuming flat oil prices out into the distance as this report shows.
Compound the strategic risk of over-investment in fossil fuel projects with seemingly straightforward accounting rules that encourage it and you have the financial mechanics of how oil and gas companies allow seemingly irrational corporate investment decisions to be made.
The bottom line is that most of the large oil and gas firms simply assume a comfortable floor of $50-60/bbl in real terms many decades out and therefore, all new corporate investment cases seem profitable. The world at large be damned.
Investors must beware these simple underlying assumptions of smooth invariable revenues, against true stress tests of corporate viability, such as the IEA’s NZE prices of $25-35/bbl, and the likely non-linear changes we have mentioned earlier due to S-curve impacts of new technologies.
Corporate Profile – J Power in focus
Figure 4: Coal phase-out for J-Power wholly owned assets under NZE2050

The conflicts of new and old energy in this transition is shown in microcosm in our corporate report on J-Power, a major Japanese utility firm which has a monopoly on grid connections between Japan’s four major islands.
Despite much corporate marketing, this report shows how J-Power has limited ambition for renewables, is investing in coal and gas plants internationally, and is using carbon capture technologies to extend the life of its coal-fire based power plants. It’s Net Zero 2050 ambitions therefore look undermined, symptomatic of current pledges more widely.
And finally our latest report on oil and gas decommissioning liabilities in the US shows how the fossil fuel industry, in trying to exit in a world of accelerating new energy alternatives, may be leaving behind major liabilities. With over two million abandoned oil and gas wells across the US there is growing concern about how these legacy assets can be effectively decommissioned safely and economically.
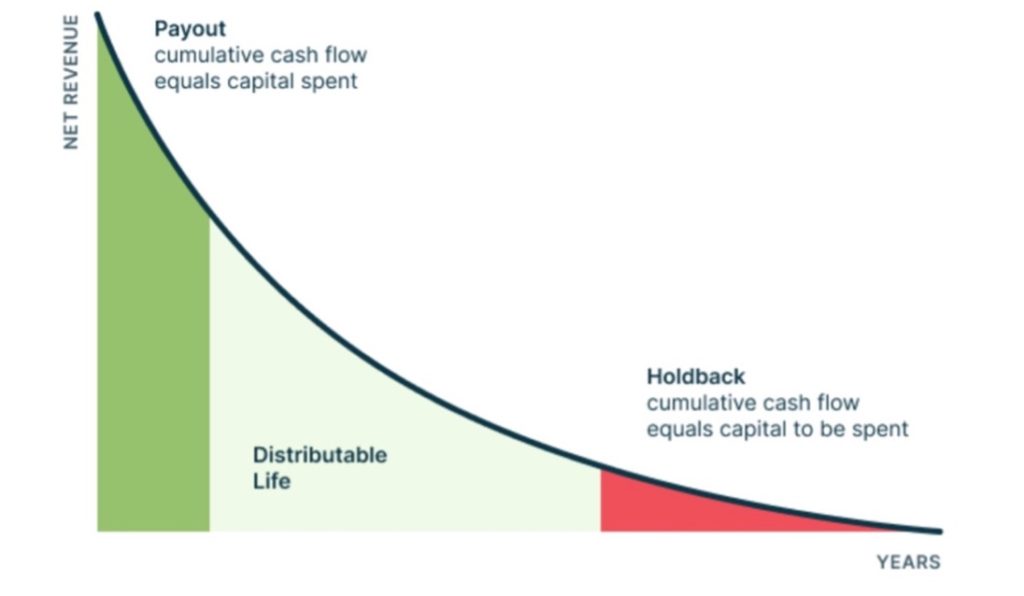
Figure 5: Phases in the economic life of a well