


Blog Series: The UK’s adoption of BEVs – in 2016 UK BEV car sales (all electric) were a mere one in a 100, and derided. By the end of 2023, one in three new UK car sales could be BEVs, snubbed no more.
‘Tracking the S-Curve’ will be a regular blog aimed at providing insight on the transition to electric transport. The adoption of battery electric vehicles (BEVs) is happening right now, at a rapid pace.This evolving blog will track and predict new BEV sales versus an S-Curve growth cycle, and provide analysis, commentary, and expert insight on sector and regional trends.
As transport emissions globally amount for more than 20% of total emissions, on a par with global power emissions, this BEV transformation is one of the most important required to create the energy transition, and generate new efficient low-emission, lower-cost and sustainable energy growth technologies.
The blog is a product of ongoing collaboration between Carbon Tracker and New AutoMotive (a non-profit, independent transport research organisation). As of December 2022, the two companies are working together on research projects and will use their combined expertise to enhance investors’, policymakers’ and other stakeholders’ understanding of the automotive energy transition.
Fix fossil fuel problems with electrons – ‘22 in review
Last year was largely defined by Putin’s war in Ukraine, with the conflict sending ripple effects worldwide and shaking up the energy complex. Dependency on Russian fossil fuels has forced European nations to desperately seek new sources of oil and gas supply, causing prices for these commodities to spike , and prolonging the rising price trend caused by the post-COVID-19 economic cycle recovery.
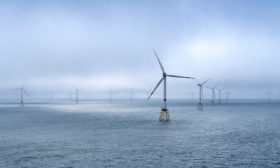
Energy security is now a top priority for many national governments, but a fixation on fossil fuels has enabled Putin to weaponize energy. Investment in renewables and the adoption of electric vehicles is now more important than ever, and offers a long-term solution to fossil fuel failures. Electrified transport is powered with electrons which can derive from various domestically produced sources, increasingly wind and solar, rather than depending on imported fuels.
European policy is facilitating the need for an electrified vehicle fleet to reduce reliance on fossil fuels and meet climate goals. The EU will ratify the provisional political agreement (agreed in October 2022) to ban ICE vehicle sales in the EU by 2035, signalling the long overdue demise of this 100+ year old technology.
But market dynamics may force this demise far sooner; if emissions concerns started this transformation of transport, economic preferences will likely finish it.
The past year has proved that consumer demand for BEVs is still strong, despite headwinds such as inflation and supply constraints of some models, even conservative scenarios still see 50% of sales being BEV by 2027.
This has led to waiting times of up to 18 months for some new BEVs in Europe. Whilst global vehicle production has been hampered by the on-going semiconductor shortage, the shift from an industry or policy ‘push’ to a consumer ‘pull’ is an important tipping point in the development of the BEV market.
Examining the UK market in more detail we see all the elements of the global shift in transport technology from fossil fuels to electricity.
Even as the UK car market dampened slightly over 2022, demand for BEVs has remained strong and sales have grown, with fossil fueled car sales taking most of the blow of these contractions, demonstrating the strength of consumer need for BEVs. The overall new car market shrank by 3% over 2022, with fossil fuel sales down by 8%, but new BEV registrations still grew 38%.
What this means for the car industry generally, OEMs, oil demand, consumers and supply chain opportunities in batteries and BEV infrastructure will be the subject of future blog episodes.
UK electric vehicle market climbing the S-Curve
This first blog of a series focuses on the high-level “S-curve” of demand for BEVs in the UK. The S-curve is a well-established phenomenon where a successful new technology reaches a certain catalytic tipping point (typically 5-10% market share), and then rapidly reaches a high market share (i.e 50%+) within just a couple more years once past this tipping point. In a global car market where overall growth might only be 1-2% per year, this phenomenon is devastating for the incumbent fossil-fuel powered technology, whose new sales will experience sharp declines.
Over the past four to five years the global sales of BEVs have shown a sharp upturn, with sales growing 10x over the past five years to reach over 6% market share globally. This figure is expected to grow to almost 9% global sales for 2022, an increase of around 50-60%. This shows all the hallmarks of an S-curve growth trend, and will likely mean BEVs reach 50% market penetration by the mid 2020s. The alternative model of slower, more linear growth would now be a very risky investment approach to take, hence our emphasis on the non-linear S-Curve as a model for future market direction.
In our model we have used historical data and not assumed an end date for 90-100% market share. The existing data aligns with current trends, with and without policy support, as competitive market forces, including the supply of BEVs and critical charging infrastructure, have now been mobilised at scale. Thus, policies like the UK/ EU’s ICE ban now reflect, as well as accelerate, consumer choice and the S-curve’s remorseless structural change.
The global car industry has almost certainly seen the peak in new ICE vehicle sales, and more and more motorists are choosing to go all electric when buying a new car. 2017 was probably the year new ICE sales peaked in the UK, with 2022 likely the peak of ICE on-road fleets, according to analysts such as Bloomberg.
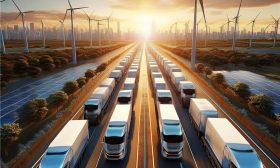
It is increasingly clear that we are at the steep climb of the S-Curve for all types of BEVs from two-wheelers to passenger cars, to commercial and heavy goods vehicles (HGVs). This is a time of great opportunity, but also a period where risk must be properly managed.
The graphs below show the UK’s new passenger BEV sales versus an adoption S-Curve. 2022 annual BEV sales in the UK are estimated to be around 250k; approximately one out of six registered vehicles (~17% market share). This is an increase of 69k vehicles compared with 2021, where BEVs had a 11% market share. Following the trajectory of the S-Curve and based on our short-term forecast modelling, it is expected that the market share of new BEV sales in the UK could reach 33% or one in three by the end of 2023.
Why does the S-Curve matter?
In 2016, UK BEV sales were less than one in a 100; by the end of 2023, one in 3 new cars registered in the UK could be fully electric. In 2016, the ratio of BEVs on the road to fossil fueled cars was 1:2,500; by the end of 2024 it will likely be 1:30, growing to 1:12 by the end of 2025. If you begin to notice more BEVs in your High Street (and charging posts along the pavements), these numbers may explain why.
The shift may not be smooth: the overall flat demand for new cars and the industry-wide impact of the “Osborne Effect” could potentially disrupt the transition, as consumers delay the purchase of new BEVs and ICE cars. However, the overall direction of travel is clear.
Whilst there may be reaction from incumbent car firms and lobbyists suddenly aware of this disruption, the maths and economics are fearsome. By 2025 new UK BEV sales could be 1:1 with petrol cars (diesel sales are already negligible), and one in every 10-12 cars on the road will be moved by electrons, not petrol. This will have a major impact on both the demand for oil and on carbon emissions – we will cover these impacts in later blogs.
As one new technology emerges at the pace of an S-curve, another is removed at an exponential rate (see graphs below). For those selling brand new ICE cars, the business model has literally been up-ended.
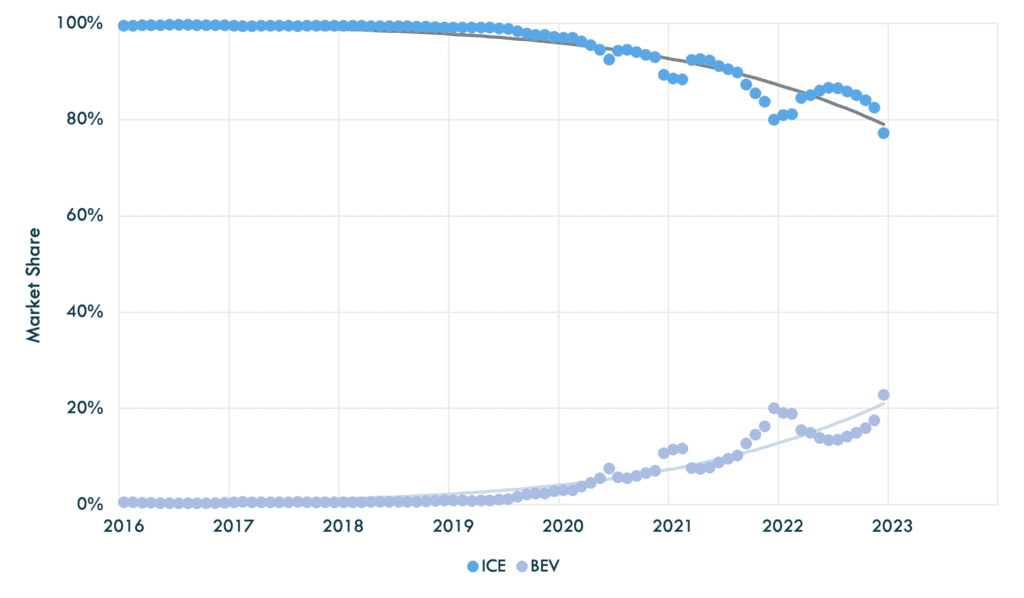
UK New Vehicle Sales – BEV and ICE Market Share – Adoption S-Curves
![]()
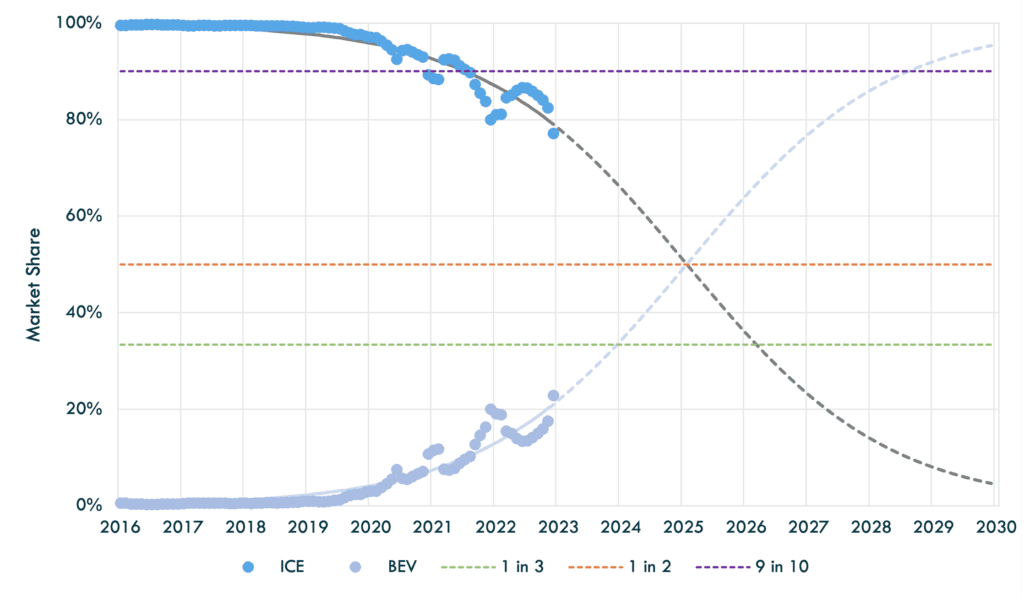
Source: New AutoMotive, Carbon Tracker. Note: The individual data points show actual new sales market share. Sales are averaged over a 3-month rolling period. The S-Curves are plotted using a logistic function with the projection shown with a dashed line. ‘ICE’ is defined as all vehicles with an internal combustion engine, including hybrids.
Selling BEVs is the only way automakers can meet climate goals and be aligned to the Paris Agreement. Carbon Tracker has provided an analysis on how well aligned automakers are to this climate treaty, which can be found here.
As BEV sales accelerate, so does the competitive landscape, as more vehicles and manufacturers enter the market. Incumbents who enjoyed leading market shares in ICE vehicle segments, but are laggards in electrification, may find their position in the market at risk. UK market leader Volkswagen’s sales have dropped 20,000 compared to last year, a 14% drop, reducing their overall market share from 9% to 8%. Despite increasing BEV sales in 2022, VW lost the top-selling manufacturer position in the UK. Incumbent manufacturers who currently have the highest market share have the most to lose in the automotive energy transition, unless they electrify effectively.
Even established EV manufacturers, such as Nissan and Tesla, who brought BEVs to market relatively early on (2011/2012), now risk losing market share to new entrants including Chinese automakers. China, which dominates much of the supply of critical battery materials, could flood the European market with new, more affordable BEVs, displacing established automotive players. 2022 saw the beginning of this trend with more than 15k BEVs from Chinese OEMs registered in the UK, or 6-7% market share. It is apt that the majority of these UK-registered Chinese BEVs are from MG, a former British marque, reborn under parent company SAIC Motor.It is likely that those companies with zero or low legacy ICE manufacturing capacity such as Tesla, Chinese OEMs and some other start-up such as Rivian will start to be highly competitive in the global car market. ICE manufacturing sunk capex and expertise become more a hindrance than a benefit in the new world dominated by BEVs arriving at the highly disruptive pace of the S-Curve.
UK New Vehicle Sales – BEV Market Share
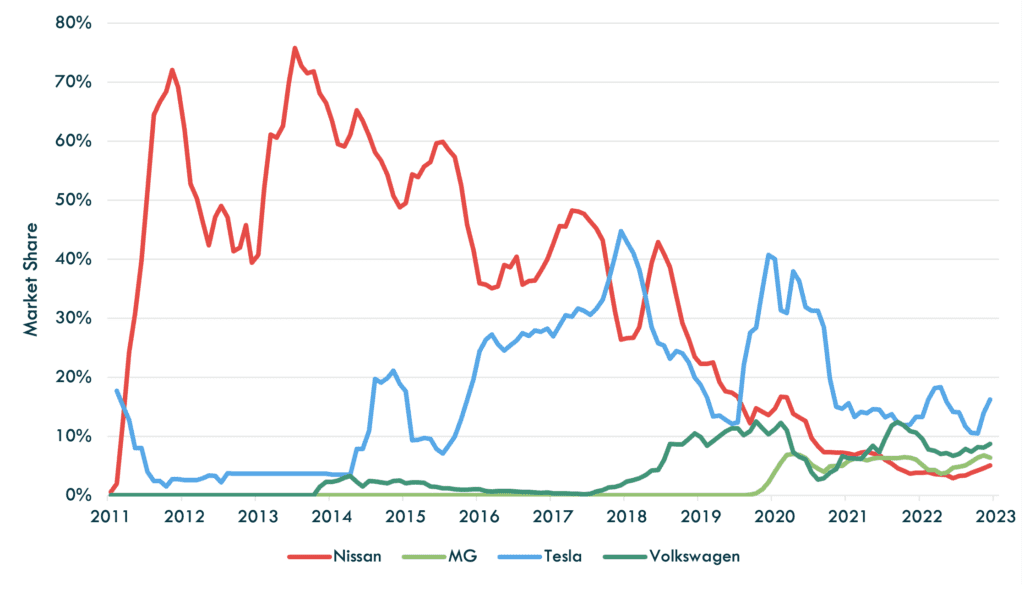
Source: New AutoMotive, Carbon Tracker. Note: BEV market share of UK New Vehicle Sales. Sales are averaged over a 3-month rolling period. In 2011, the UK new BEV market size was ~1.3k vehicles. By 2022, the UK new BEV market size grew to ~250k vehicles.
To conclude, the emergence of BEV sales in the UK echoes wider global trends:
- The S-Curve of manufactured technology solutions, in this case BEVs, in reaction to the world’s climate emissions issues, and supported by long-sighted governmental policies around the globe.
- The disruption to a multi-trillion industry with the substitution of fossil fuel powertrains to vehicles powered by batteries, leading to a re-ordering of OEM and national dominance.
- The ability for this to reduce global transportation emissions; 20% of the world’s total, on a par with that from global power.
- The adoption of BEVs is going to be faster than many people anticipate. In turn, this is going to seriously challenge OEMs’ vehicle sales strategies, position in the market and future earnings.
In future blogs in the series we will cover these themes, and related ones, in more detail, and analyse in depth the implications of a non-linear transition via the S-curve – for OEMs and their supply chains, consumers, policymakers and providers of fossil fuels whose once dominant monopoly position in the global car market has now, quite suddenly, ended.