


Carbon Tracker has long warned of the risk of investing in future stranded assets; i.e., assets that fail to generate the returns expected when sanctioned. The data evidence some level of risk averse behavior by industry over the past decade, yet some are advocating that industry returns to its old ways; this could be a mistake.
Since 2014, Carbon Tracker has highlighted the potential risk to oil and gas projects that are sanctioned without fully allowing for the impact of climate policy and the substitution effects of technology development on the demand for oil and gas. Carbon Tracker has considered a range of demand profiles from energy transition scenarios corresponding to temperature outcomes of 2°C, all the way down to 1.5°C (low overshoot[1]).
The risk from lower future demand is that long-term commodity prices are lower than anticipated, and thus many projects would fail to generate an economic return (i.e., not reaching their hurdle rate), becoming financially stranded.
Furthermore, industry overinvestment in anticipation of continued rising demand would likely cause oversupply in the face of an energy transition, with prices falling even further. Clearly this would result in a marked fall in returns for shareholders. (This was exactly what happened after 2014 following the industry capex-binge between 2010-2014. See Exxon note.[2])
In response, Carbon Tracker has advocated that the O&G industry should take a cautious view of the future. Management should impose higher hurdle rates to compensate for increased risk, with capital expenditure limited to only the most cost-competitive projects.
This note looks at how this has played out in the oil industry. Importantly Carbon Tracker sees a measure of success as to whether the industry has become disclipined in its capex avoiding stranded assets and staying at least in line with a cautious demand outlook. Evidence is positive.
The industry is becoming more disciplined, despite recent high prices
While the past 10 years has seen the 2020-22 Covid related volatility, and a period of reduced investments, the peak exuberance in oil reserve development and capex was between 2010 and 2014, the latter year being the date of Carbon Tracker’s first publication looking at supply curves.
Oil demand has also been volatile, only now returning to its 2019 peak following the demand shock from Covid in 2020-22, and the supply shock of Russia’s invasion of Ukraine which sent prices upwards.
Looking at the full global picture for oil capex from the IEA’s World Energy Investment 2023 (Figure 1, red bar), it is evident that total capex has been subdued since 2014 through 2021 but is now starting to rise, a trend echoed by a recent paper by Goldman Sachs based on its subset of global data (the Top 70 giant projects) shows that oil development peaked in 2014-15.[3]
Figure 1. Global investment in fuel supply, 2010-2023e, reproduced from IEA
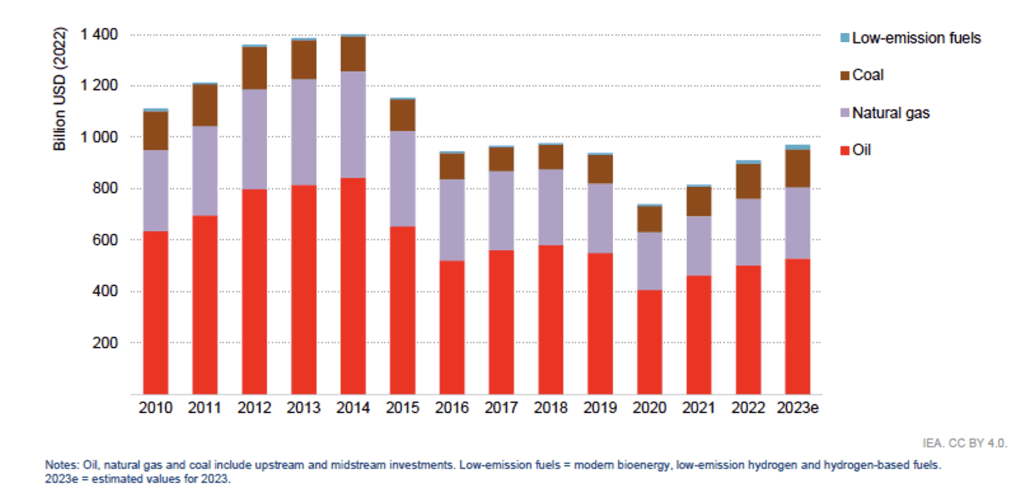
Source: IEA
In explaining the post 2015 and post 2019 falls in capex, Goldman point to the role that decarbonisation constraints and ESG issues have put on investor and finance thinking. “The energy industry has been so risk-averse in the last few years, and under such tremendous pressure from decarbonization to not invest.”
Goldman sees this as “underinvestment”. In Carbon Tracker this is seen as prudent risk management. As the IEA shows it has been dividends and not capex that has been the major recipient of company cashflow. Investment in green energy has been low.
Figure 2. Distribution of cash spending by the oil and gas industry (2008-2022), reproduced from IEA
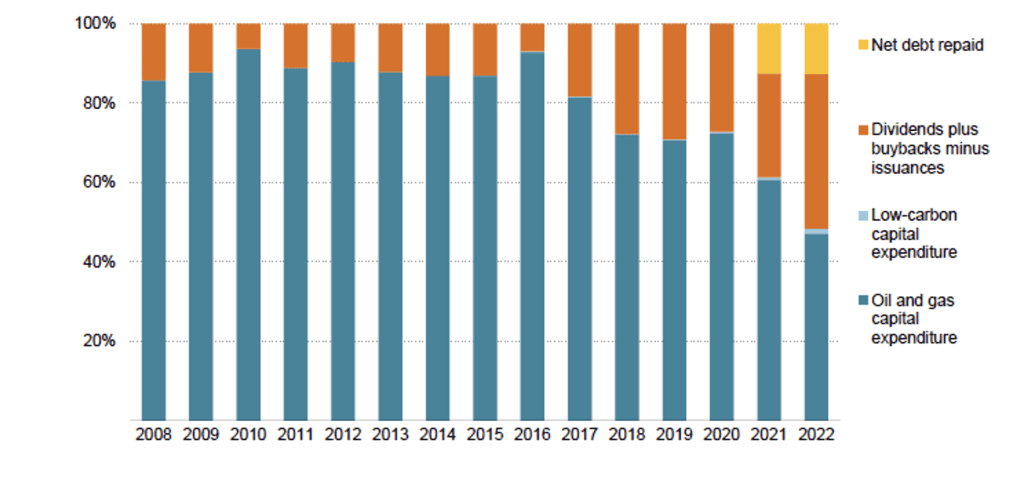
Source: IEA (World Energy Investment 2023)
In our view this shows success in avoiding potential stranded assets. If the pre-2014 boom exuberance had continued, there would likely have been even more oversupply over the timeframe.
It vindicates investor caution based on analysis such as that carried out by Carbon Tracker. Instead of seeing value destroyed by economically stranded assets, shareholders benefited from increased cash returns. As a result, the underperformance of big oil during 2014-2019 was eventually stabilised.
Where to from here? Risks rising again.
Further, we argued in Managing Peak Oil, that the industry should be very cautious about committing to new long cycle projects, as demand would be peaking out and starting to decline before the end of this decade[4]. We pointed to short cycle projects as less risky.
Recent industry investment behavior has corresponded to these risks (Figure 3), and as Goldman notes recent capex has been short cycle: “Most of the capex growth last year was driven by U.S. shale. It was clearly a U.S. onshore-led capex recovery.”
Figure 3. Share of oil and gas investment by asset type, 2000-2023e, reproduced from IEA
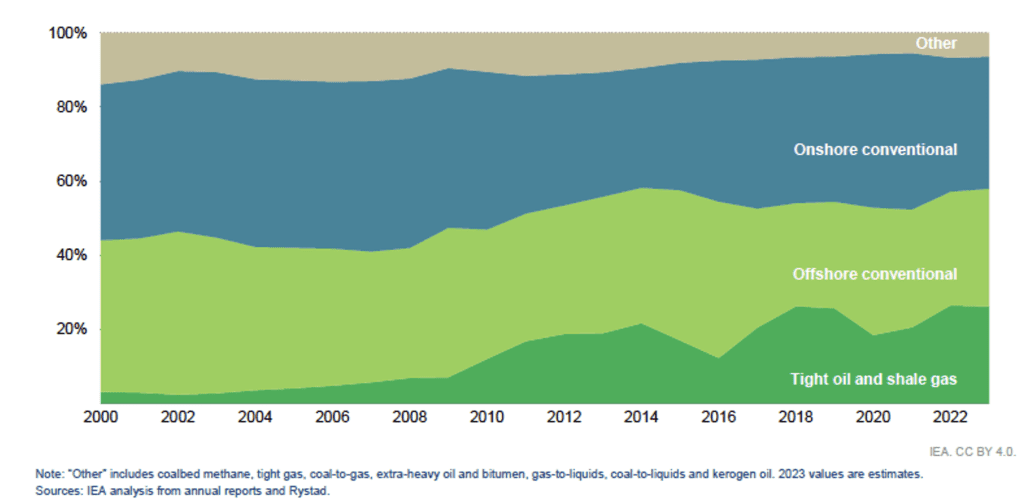
Source: IEA
Intrestingly, it has been those firms least exposed to capital market pressures that have invested most in a business-as-usual way: according to the IEA, it is Middle Eastern National Oil Companies that are raising capex the most, with Independents and US majors starting to catch up (Figure 4, 2019 level as a base line).
Figure 4. Change in upstream oil and gas capital investment relative to 2019 by company type, 2020-2023e, reproduced from IEA.
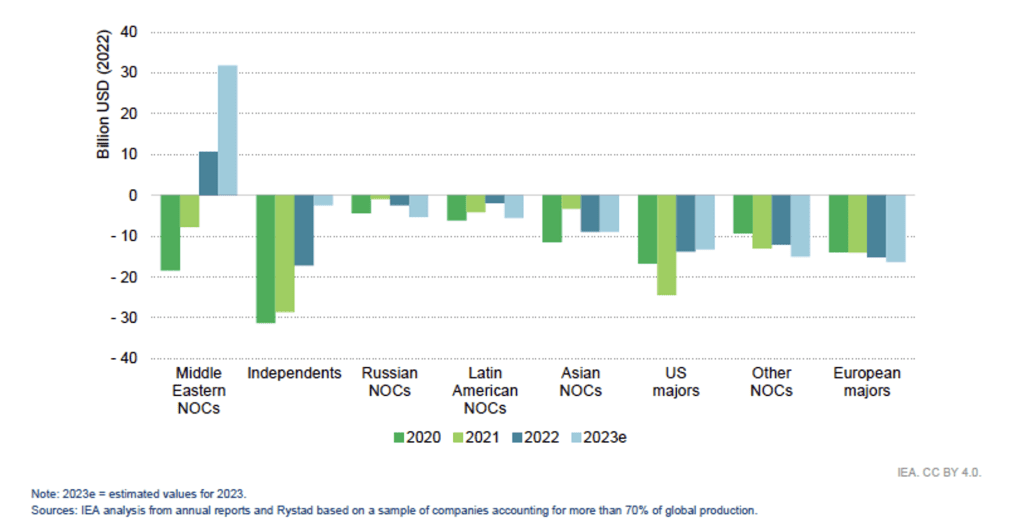
Source: IEA
Increasing risk means hurdle rates should rise, not fall
While Goldman saw capital investments rebound in 2022, based on their sample, and expects them to rise further in 2023, it still only sees them returning to around the 2014 level. Yet this, and that the resource life associated with these projects has fallen materially, is hardly a clear sign that the industry thinks oil demand is continuing to grow.
Following the Ukraine war and a gradual recovery in oil demand post covid, with prices at $70-80/bbl, Goldman argues the hurdle rate for new investment will need to fall to 15% from 20%. to generate more significant supply expansion. But we see this as an acceptance that costs have risen such that the economic returns of many new projects just don’t work at current oil prices.
Goldman explicitly accepts this as it goes on to argue that, “[t]he cost curve keeps shrinking and steepening, which means that a higher oil price will be required to balance the market.” And “… the marginal incentive price (the 75th percentile of the cost curve) is no longer $70/bl, but $80/bl (at 15% hurdle rates) and up to $100/bl (at 20% hurdle rates.”
Goldman’s argument that the industry needs to reduce its cost of capital in order to bring new supply to the market makes little economic sense. Long bond rates have risen sharply over the past several years. If anything, industry hurdle rates (cost of capital) should be going up, not down. But even if long bond yields hadn’t fallen, arguing for a cut in hurdle rates to encourage new supply doesn’t make sense to us. It argues for a rise in oil prices instead. The use of an arbitrary cut in hurdle rates to drop the oil price needed from $100 to $80 appears odd to us.
We see no reason for the industry to move to a lower hurdle rate: Hurdle rates should be set by macro-economics, not wishful thinking. Were industry to lower hurdle rates, we believe it would lead to an increased risk profile for oil and gas portfolios because it would encourage investment in higher cost, lower return assets.
In their sample, Goldman sees some evidence that oil company risk appetite is growing. Some US LNG export schemes have been sanctioned and deep-water projects are also moving forward. This could, of course, purely be down to the oil price but historically, oil companies often seem to have an increased risk appetite as oil prices rise.
There is also a suggestion that investors’ desire for capital discipline and high return projects might be having less influence on management blinded by higher oil prices. Goldman even goes as far as to say “I would characterize it as we probably reached peak ESG, or decarbonization concerns, one to two years ago,” We think that may well be the case for oil management but hopefully not for investors: they tend to have longer memories.
So, the danger of the industry getting carried away and overinvesting may be increasing. Such a change of strategy would likely lead to a build-up in stranded assets if oil demand is peaking out in the next few years.
Don’t invest for the long term based on short-term signals
Prior to stranding, however, the industry would likely see rising capital and operating costs because of overinvestment. This is a recipe for deteriorating investor and shareholder returns. This is exactly what happened post the 2010-2014 investment binge, which led to material underperformance by Big Oil and the ejection of ExxonMobil from the S&P500 and the Dow Jones.
Given tight conditions at present, the oil industry may get its $80-100 oil price dream in the short term. But how long might that last? Once oil demand starts to decline, high oil prices could be in danger unless there is a severe supply side constraint. Combined with over-investment, this could really create financially stranded assets rather than just poor returns.
The potential for a notable decline in oil demand starting by the 2030s is shown in the IPR Forecast Policy Scenario (expected to be updated in September) used in Managing Peak Oil.
The role of OPEC+ and especially Saudi Arabia will be critical in this context – a push to regain market share could see prices tumble – as happened in 2015. Oil and gas exporting nations must look to the future and see that impact that long-term declining prices could have, and look a future Beyond Petrostates.[5]
The upcoming update to Managing Peak Oil will include more guidance on what the companies should be doing in response to the energy transition/demand substitution challenge, and how investors can support them in addressing the issues, ultimately to maximise shareholder value as the transition unfolds.