


The charts below evaluate liability and bond amounts on a state level. Data was sourced from Enverus and State departments responsible for P&A bonding data. Data is updated through September 2020.
On this page:
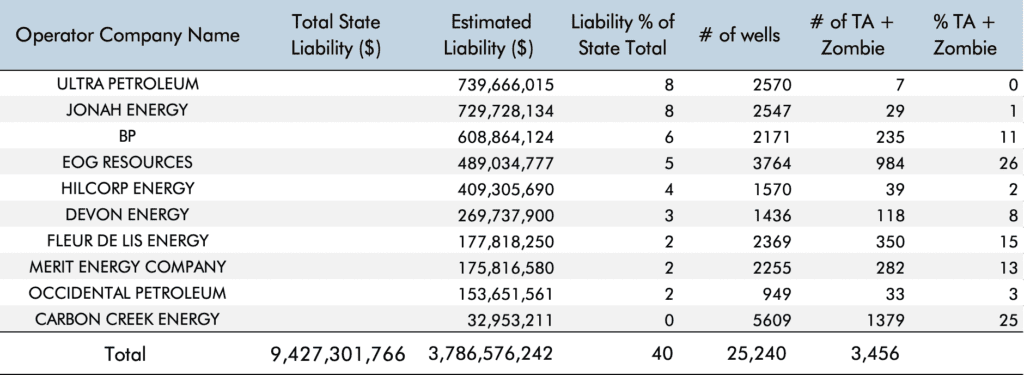
- Top 10 largest operators, by expected liability, and Top 10 largest operators, inactive wells
- Breakdown of Vintage of Wells
- Total bond amount, Total liability amount, bonding ratio
- Focus Area: Colorado Blanket Bonds
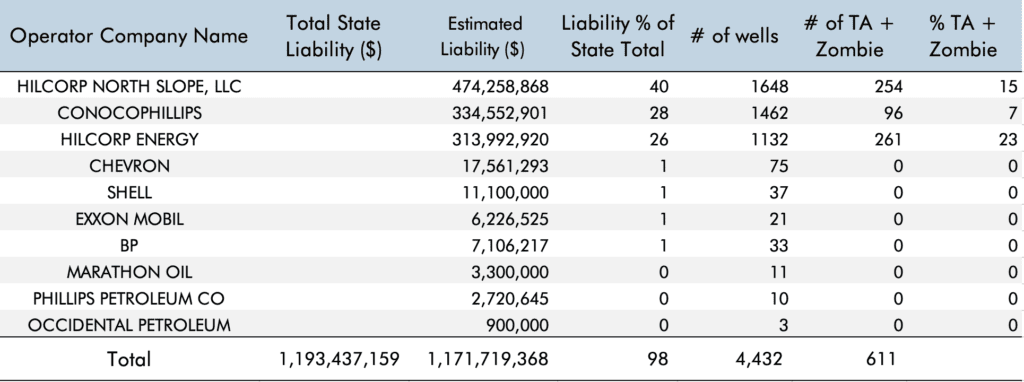
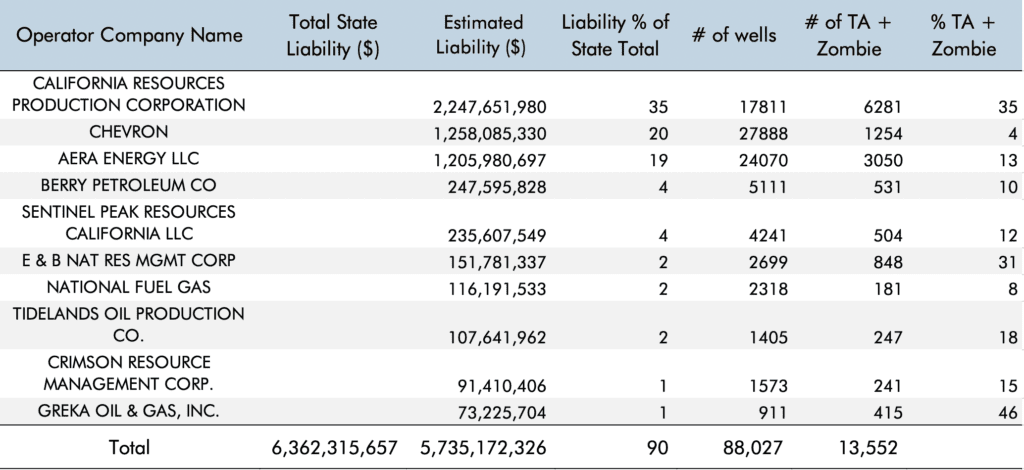
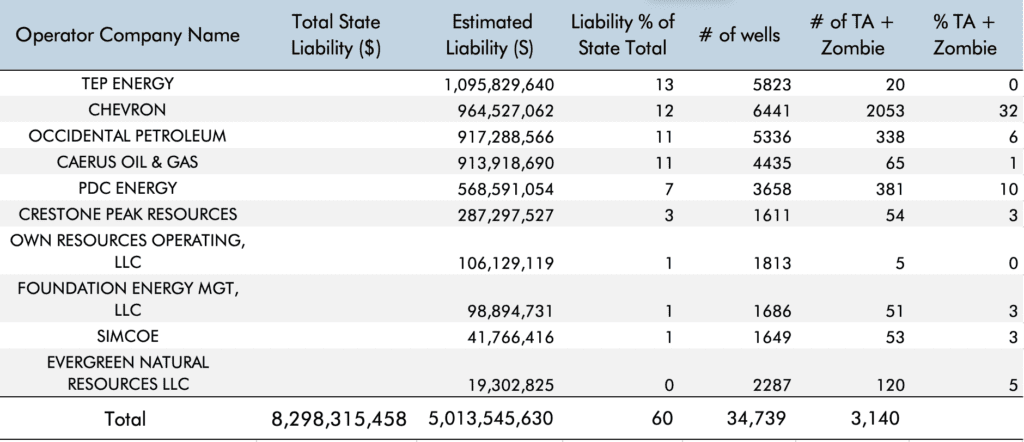
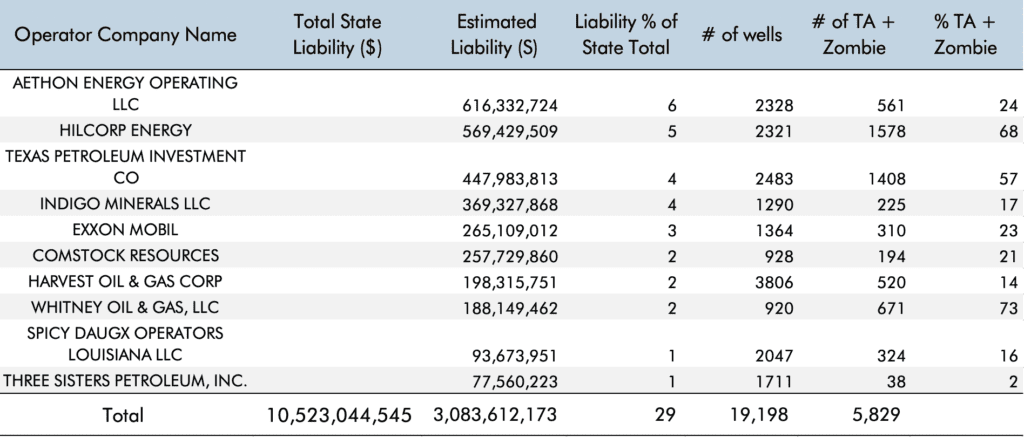
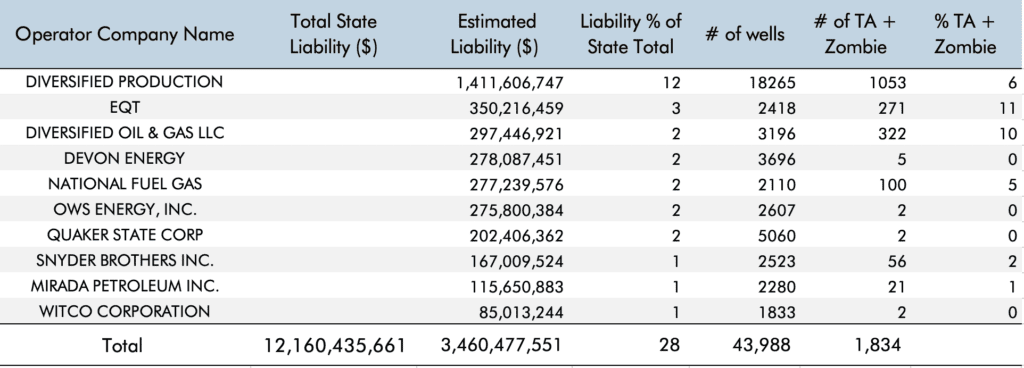
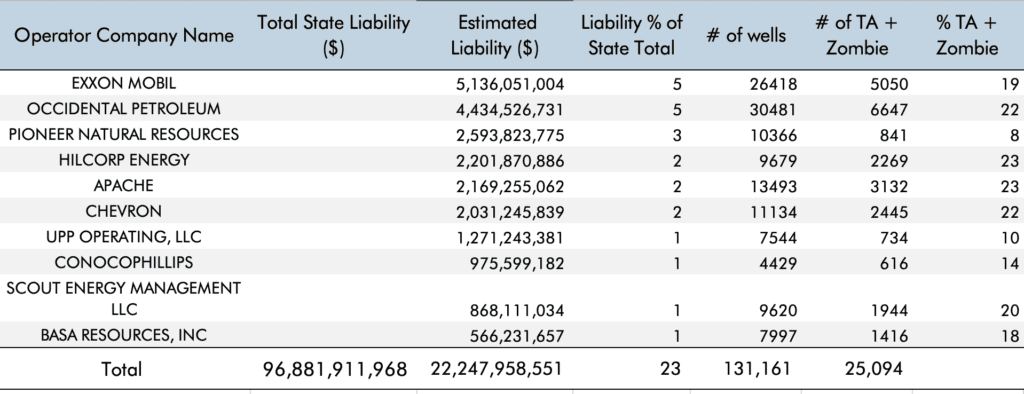
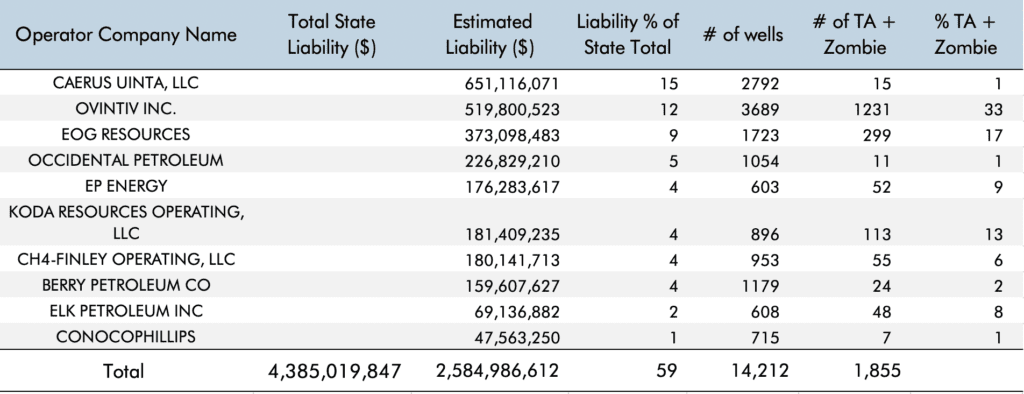
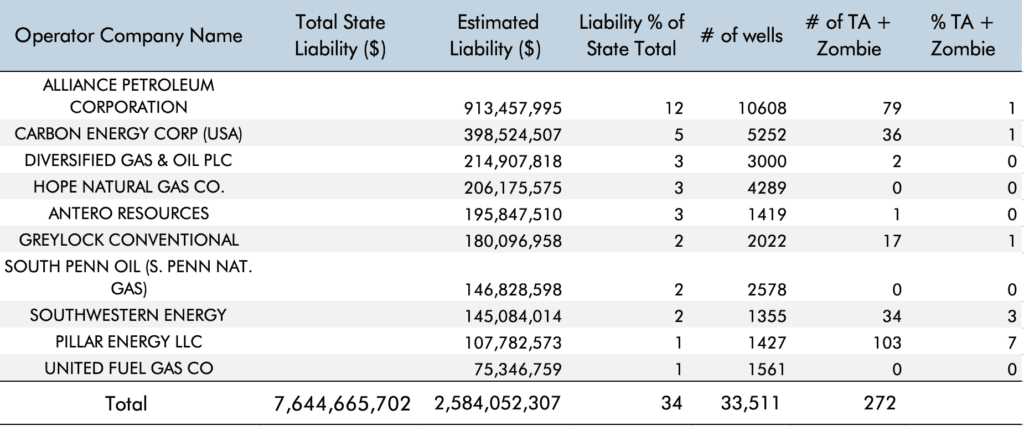
Top 10 largest operators, by expected liability, and Top 10 largest operators, inactive wells
Alaska
California
Colorado
Louisiana
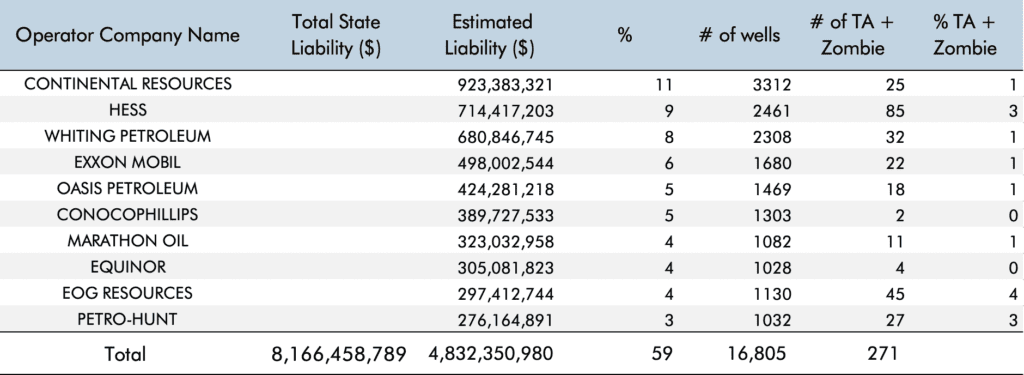
North Dakota
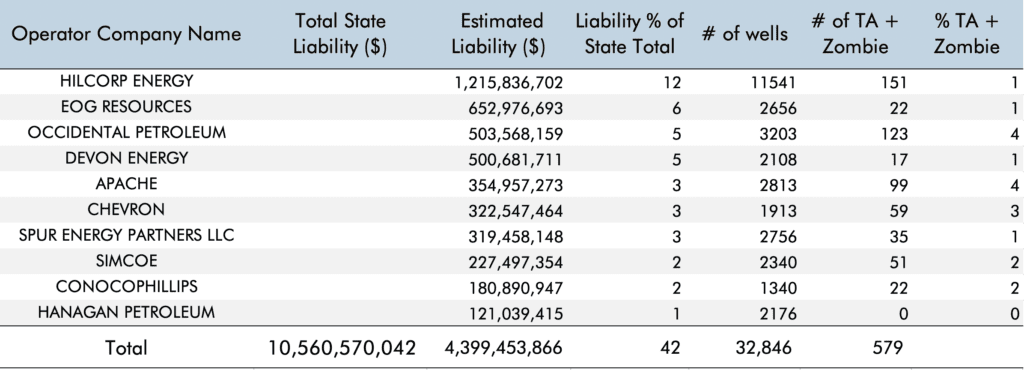
New Mexico
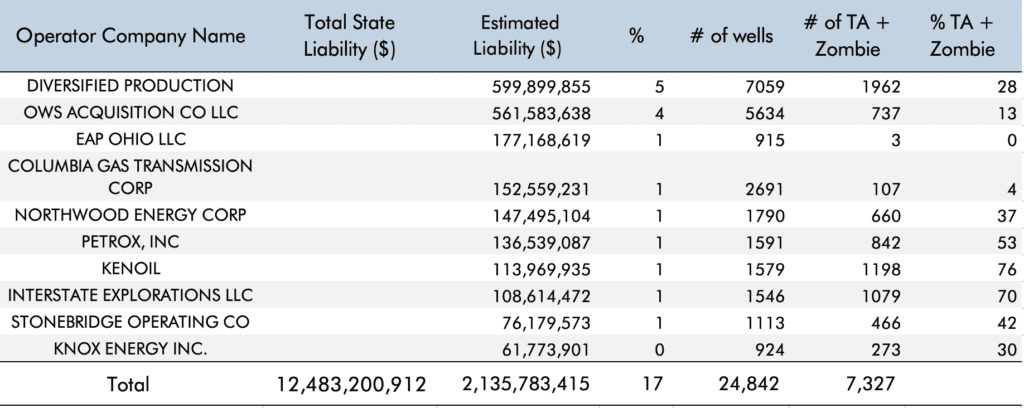
Ohio
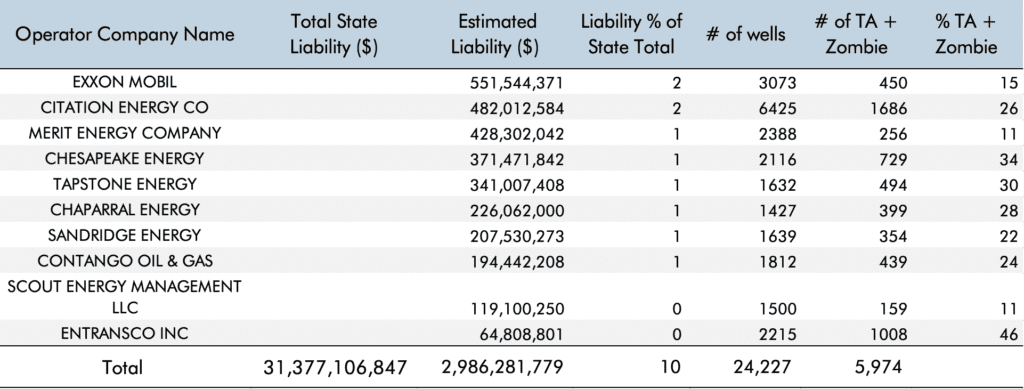
Oklahoma
Pennsylvania
Texas
Utah
West Virginia
Wyoming
Return to top
Breakdown of Vintage of Wells
Well Type | # Wells | Estimated cost | % of cost |
Alaska | |||
Producing | 2,150 | $559,577,951 | 47% |
Stripper | 245 | $60,042,279 | 5% |
Injection + other | 1,779 | $416,106,047 | 35% |
TA (LP>24<60) | 195 | $49,498,166 | 4% |
Zombie (LP>60) | 436 | $108,212,716 | 9% |
TOTAL | 4,805 | $1,193,437,159 | 100% |
California | |||
Producing | 5,372 | $399,384,929 | 6% |
Stripper | 18,283 | $1,226,280,016 | 19% |
Injection + other | 66,321 | $3,384,640,904 | 53% |
TA (LP>24<60) | 4,135 | $299,900,842 | 5% |
Zombie (LP>60) | 13,173 | $1,052,108,967 | 17% |
TOTAL | 107,284 | $6,362,315,657 | 100% |
Colorado | |||
Producing | 13,425 | $1,969,672,557 | 24% |
Stripper | 29,907 | $4,014,022,255 | 48% |
Injection + other | 11,351 | $1,598,627,847 | 19% |
TA (LP>24<60) | 3,056 | $483,875,187 | 6% |
Zombie (LP>60) | 1,972 | $232,117,612 | 3% |
TOTAL | 59,711 | $8,298,315,458 | 100% |
Louisiana | |||
Producing | 5,874 | $1,616,822,685 | 15% |
Stripper | 27,770 | $2,946,946,978 | 28% |
Injection + other | 18,773 | $3,162,615,877 | 30% |
TA (LP>24<60) | 4,212 | $585,921,117 | 6% |
Zombie (LP>60) | 14,411 | $2,210,737,888 | 21% |
TOTAL | 71,040 | $10,523,044,545 | 100% |
North Dakota | |||
Producing | 12,957 | $3,745,190,641 | 46% |
Stripper | 5,009 | $1,174,492,632 | 14% |
Injection + other | 11,703 | $3,056,601,700 | 37% |
TA (LP>24<60) | 322 | $80,036,489 | 1% |
Zombie (LP>60) | 504 | $110,137,327 | 1% |
TOTAL | 30,495 | $8,166,458,789 | 100% |
New Mexico | |||
Producing | 12,542 | $2,176,315,206 | 21% |
Stripper | 38,507 | $4,792,230,282 | 45% |
Injection + other | 19,459 | $3,237,137,679 | 31% |
TA (LP>24<60) | 1,376 | $154,793,661 | 1% |
Zombie (LP>60) | 1,866 | $200,093,213 | 2% |
TOTAL | 73,750 | $10,560,570,042 | 100% |
Ohio | |||
Producing | 2,617 | $577,276,283 | 5% |
Stripper | 38,511 | $3,123,159,651 | 25% |
Injection + other | 93,014 | $5,991,701,544 | 48% |
TA (LP>24<60) | 8,494 | $627,231,458 | 5% |
Zombie (LP>60) | 28,766 | $2,163,831,975 | 17% |
TOTAL | 171,402 | $12,483,200,912 | 100% |
Oklahoma | |||
Producing | 12,740 | $2,867,989,084 | 9% |
Stripper | 61,476 | $8,287,616,961 | 26% |
Injection + other | 157,476 | $14,993,064,144 | 48% |
TA (LP>24<60) | 11,037 | $1,345,148,000 | 4% |
Zombie (LP>60) | 42,743 | $3,883,288,658 | 12% |
TOTAL | 285,472 | $31,377,106,847 | 100% |
Pennsylvania | |||
Producing | 9,971 | $1,619,558,856 | 13% |
Stripper | 70,042 | $5,005,494,960 | 41% |
Injection + other | 49,050 | $4,100,144,528 | 34% |
TA (LP>24<60) | 8,422 | $559,386,368 | 5% |
Zombie (LP>60) | 13,817 | $875,850,950 | 7% |
TOTAL | 151,302 | $12,160,435,661 | 100% |
Texas | |||
Producing | 66,740 | $15,218,977,456 | 16% |
Stripper | 234,282 | $37,017,668,172 | 38% |
Injection + other | 189,924 | $27,742,143,057 | 29% |
TA (LP>24<60) | 25,786 | $3,856,141,772 | 4% |
Zombie (LP>60) | 103,766 | $13,046,981,510 | 13% |
TOTAL | 620,498 | $96,881,911,968 | 100% |
Utah | |||
Producing | 2,839 | $613,882,358 | 14% |
Stripper | 9,299 | $1,625,850,549 | 37% |
Injection + other | 9,190 | $1,759,155,242 | 40% |
TA (LP>24<60) | 893 | $140,638,546 | 3% |
Zombie (LP>60) | 1,885 | $245,493,151 | 6% |
TOTAL | 24,106 | $4,385,019,847 | 100% |
West Virginia | |||
Producing | 3,163 | $473,404,390 | 6% |
Stripper | 53,823 | $4,153,636,486 | 54% |
Injection + other | 42,003 | $2,920,922,288 | 38% |
TA (LP>24<60) | 951 | $64,106,608 | 1% |
Zombie (LP>60) | 504 | $32,595,930 | 0% |
TOTAL | 100,444 | $7,644,665,702 | 100% |
Wyoming | |||
Producing | 11,561 | $2,763,639,558 | 29% |
Stripper | 20,011 | $2,824,480,721 | 30% |
Injection + other | 20,495 | $3,084,126,952 | 33% |
TA (LP>24<60) | 3,421 | $339,623,094 | 4% |
Zombie (LP>60) | 7,091 | $415,431,442 | 4% |
TOTAL | 62,579 | $9,427,301,766 | 100% |
Return to top
Total bond amount, Total liability amount, bonding ratio
State | CTI Liability Estimate ($B) | CTI Bonding Estimate ($) | Bonding Ratio (%) |
Alaska | 1.2 | 57,750,000 | 5% |
California | 6.4 | 117,601,580 | 2% |
Colorado | 8.3 | 162,276,065 | 2% |
Louisiana | 10.5 | 504,204,429 | 5% |
New Mexico | 10.6 | 97,992,704 | 1% |
North Dakota | 8.2 | 83,350,000 | 1% |
Ohio | 12.5 | 22,353,710 | 0% |
Oklahoma | 31.4 | 62,281,698 | 0% |
Pennsylvania | 12.2 | 47,178,549 | 0% |
Texas | 96.9 | N/A | N/A |
Utah | 4.4 | 18,708,450 | 0% |
West Virginia | 7.6 | 28,733,376 | 0% |
Wyoming | 9.4 | 194,159,090 | 2% |
Return to top
Focus Area: Colorado Blanket Bonds
Can industry afford more financial assurance for its wells?
The numbers suggest they can.
On a combined basis, the top 10 operators in Colorado cover plugging liability on 31,707 wells through blanket bonds — that’s 62% of the total number of unplugged wells in the state. The face value of those bonds is a mere $1,000,000. Typical industry premiums are 1%, so these operators pay a mere $10,000 per year in premiums — an average of $0.32 per well.
Top Ten Operators | Number of Unplugged Wells* 62% of Unplugged Wells | Blanket Bond Coverage | Estimated Annual Premium 1% | Average Blanket Bond Coverage Per Well | Average Annual Blanket Bond Premium Per Well |
31,707 | $1,000,000 | $10,000 | $32 | $0.32 | |
TEP ROCKY MOUNTAIN LLC | 5,444 | $100,000 | $1,000 | $18 | $0.18 |
NOBLE ENERGY | 4,803 | $100,000 | $1,000 | $21 | $0.21 |
KERR MCGEE | 4,952 | $100,000 | $1,000 | $20 | $0.20 |
CAERUS PICEANCE LLC** | 4,326 | $100,000 | $1,000 | $23 | $0.23 |
PDC ENERGY INC | 3,409 | $100,000 | $1,000 | $29 | $0.29 |
EVERGREEN NATURAL RESOURCES LLC | 2,263 | $100,000 | $1,000 | $44 | $0.44 |
OWN RESOURCES OPERATING LLC | 1,814 | $100,000 | $1,000 | $55 | $0.55 |
FOUNDATION ENERGY MANAGEMENT LLC | 1,684 | $100,000 | $1,000 | $59 | $0.59 |
CRESTONE PEAK RESOURCES OPERATING LLC | 1,536 | $100,000 | $1,000 | $65 | $0.65 |
LARAMIE ENERGY LLC | 1,476 | $100,000 | $1,000 | $68 | $0.68 |