


Media Resources
Looking for more information? Here’s everything you should need.
Key Quotes
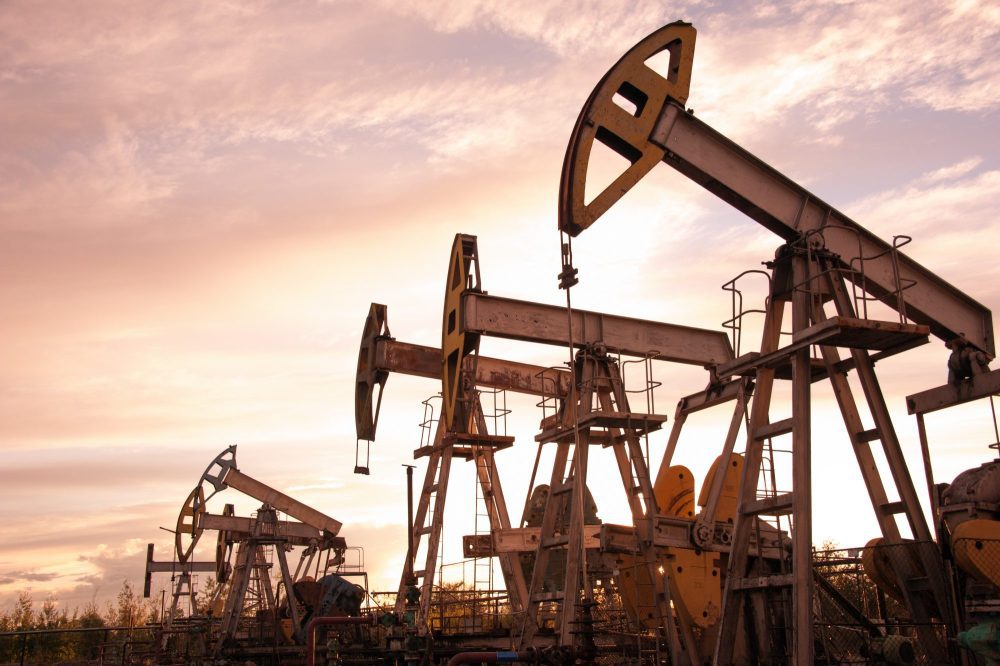
Kingsmill Bond, Carbon Tracker’s energy strategist and report lead author, said: “We are entering a new epoch, comparable to the industrial revolution. Energy will tumble in price and become available to millions more, particularly in low-income countries. Geopolitics will be transformed as nations are freed from expensive imports of coal, oil and gas. Clean renewables will fight catastrophic climate change and free the planet from deadly pollution.”
Harry Benham, report co-author and chairman of thinktank Ember-Climate, said: “The world does not need to exploit its entire renewable resource -- just 1% is enough to replace all fossil fuel usage. Each year we are fuelling the climate crisis by burning three million years of fossilised sunshine in coal, oil and gas while we use just 0.01% of daily sunshine.”
Renewables could power world by 2050 as prices collapse, replacing all fossil
LONDON/NEW YORK, 23 April – Huge falls in the cost of solar and wind power in the last few years have unlocked an energy reserve that can meet world demand 100 times over — and most is already economic compared with fossil fuels, finds a report from the think tank Carbon Tracker published today.
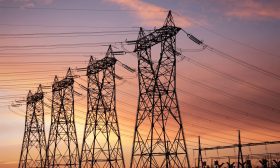
Solar and wind are inexhaustible sources of energy, unlike coal, oil and gas, and at current growth rates will push fossil fuels out of the electricity sector by the mid-2030s. By 2050 they could power the world, displacing fossil fuels entirely and producing cheap, clean energy to support new technologies such as electric vehicles and green hydrogen.
Kingsmill Bond, Carbon Tracker’s energy strategist and report lead author, said: “We are entering a new epoch, comparable to the industrial revolution. Energy will tumble in price and become available to millions more, particularly in low-income countries. Geopolitics will be transformed as nations are freed from expensive imports of coal, oil and gas. Clean renewables will fight catastrophic climate change and free the planet from deadly pollution.”
Global energy consumption in 2019 was 65 Petawatt hours (PWh). [1] However, with current technology the world has the potential to capture more than 5,800 PWh annually from solar PV alone [2] – as much power in a single year as could be generated by burning all known fossil fuel reserves. In addition, onshore and offshore wind could capture nearly 900 PWh a year. [3]
The Sky’s the Limit finds that around 60% of the world’s solar resource and 15% of its wind resource is already economic compared with local fossil fuel generation. By 2030 all the solar and over half of the wind is likely to be economic.
Harry Benham, report co-author and chairman of thinktank Ember-Climate, said: “The world does not need to exploit its entire renewable resource — just 1% is enough to replace all fossil fuel usage. Each year we are fuelling the climate crisis by burning three million years of fossilised sunshine in coal, oil and gas while we use just 0.01% of daily sunshine.”
Building enough solar panels to meet global energy demand would take up just 0.3% of land, less than the area occupied by fossil fuels. The world’s largest oilfield, Ghawar in Saudi Arabia, which occupies 8,400 square kilometres, produces the equivalent of 0.9 PWh each year. Building solar panels over the same area would generate 1.2 PWh a year on average globally and 1.6 PWh in Saudi Arabia which is sunnier than average.
The study finds that the opportunity is greatest in emerging markets that have the highest solar and wind potential relative to their domestic demand. Many are still building out their energy systems, and cheap renewables offer a route to bring power to more people, create new industries, jobs and wealth. Africa has a massive 39% of global potential and could become a renewables superpower.
The economic potential of solar has been unleashed by a huge fall in costs, down by an average 18% every year since 2010. It is growing faster than any previous energy technology at this size with an average annual increase of 39% in the last decade – nearly doubling capacity every two years. Wind is on a similar trajectory: over the last decade prices have fallen by an average 9% year while capacity has grown 17% a year. [4] This is driving efficiencies and advances such as better panels and higher turbines which reduce costs further.
Financial markets are waking up to the opportunity: in 2020 for the first time clean energy companies raised more money than fossil fuel companies through public offerings. [5]
The Sky’s the Limit says the key barrier to change is now political, but growth is likely to continue as more countries recognise the potential of renewables, and the opportunity is huge: in 2019 solar generated just 0.7 PWh globally and wind 1.4 PWh.
It identifies three key drivers of change.
- Economics – History shows that cheap local energy sources are quickly exploited – the rapid growth of the US shale industry in the 2010s is just one example.
- Climate change – Countries are acting to cut their use of fossil fuels in response to the climate emergency and public concern about pollution.
- Energy independence – 80% of people live in countries that import fossil fuels, so renewables offer the chance to cut costs, create local jobs and reduce their energy dependency.
The scale and falling costs of this vast cheap energy resource is likely to drive continued exponential growth in the deployment of solar and wind generation. [6] The report finds that a growth rate of 15% would see solar and wind generate all global electricity by the mid-2030s and provide all energy by 2050 as falling costs and technological advances overcome the challenges of powering sectors like steel and cement production.
The report is the first to identify four key groups of countries based on their potential to harness solar and wind resources relative to their domestic consumption:
- Superabundant, with potential at least 1,000 times greater than demand – mainly low-income countries with low energy use in sub-Saharan Africa. Renewables offer prospects of development fuelled by cheap energy.
- Abundant, with potential at least 100 times greater than demand – countries like Australia, Chile and Morocco with well-developed infrastructure and governance. They can aspire to provide renewable power to the rest of the world.
- Replete, with potential at least 10 times greater than demand – countries like China, India and the US which have enough renewable potential to satisfy their domestic needs.
- Stretched, with potentially less than 10 times demand – countries like Japan, Korea and much of Europe face tough political choices about how to tap their renewable resources most effectively.
Germany has pioneered solar and wind, provoking concerns about the cost of the energy transition and land usage, but the report says it is a special case. It is the third most “stretched” country in the world, with low potential for renewables to demand, and it subsidised them at a time when they were far more expensive. “The troubles faced by Germany are therefore highly unusual, and if they can solve them then so can everyone else,” says the report.
Countries like the UK and Korea with significant constraints on land availability are likely to make greater use of their offshore wind resources instead of pursuing solar.
The report uses BNEF data on the levelised cost of solar energy around the world to calculate what solar production is economic today, taking the mid-price in each country and comparing it with the cheapest fossil fuel. With costs expected to continue falling at similar rates the entire landmass where solar can be placed will likely have economic potential by the end of the decade.
Once the embargo lifts the report can be downloaded here: https://carbontracker.org/reports/the-skys-the-limit/
To arrange interviews please contact:
Stefano Ambrogi sambrogi@carbontracker.org +44 7557 916940
David Mason david.mason@greenhousepr.co.uk +44 7799 072320
Joel Benjamin Jbenjamin@carbontracker.org
About Carbon Tracker – The Carbon Tracker Initiative is a not-for-profit financial think tank that seeks to promote a climate-secure global energy market by aligning capital markets with climate reality. Our research to date on the carbon bubble, unburnable carbon and stranded assets has begun a new debate on how to align the financial system with the energy transition to a low carbon future. https://carbontracker.org/
[1] According to BP global energy consumption in 2019 was 584 Exajoules which is 162 Petawatt hours (PWh) of primary energy or 65 PWh of electrical energy when adjusted for thermodynamic losses. One Petawatt equals a thousand Terrawatts.
[2] Solar energy consultancy Solargis, calculates that without affecting cities, croplands, forests or conservation areas and taking average generation in the least sunny months, current technology can capture a minimum 5,800 PWh p.a.: Global photovoltaic power potential by country, Solargis for the World Bank, 2020.
[3] An improved global wind resource model, NREL, 2016
[4] Wind and solar costs from BNEF LCOE calculations. Generation figures from BP Statistical Review 2020.
[5] A Tale of Two Share Issues: How fossil fuel equity offerings are losing investors millions, Carbon Tracker, March 2021.
[6] For a more detailed analysis of growth rates and learning curves, see a recent piece from the Smith School in Oxford: A new perspective on decarbonising the energy system.