


This blog updates our 2018 note Carbon Budgets Explained.
Carbon budgets – the amount of carbon dioxide emissions permitted over a period of time to keep within a certain temperature threshold – have grown in importance in the climate change debate in recent years. Carbon Tracker has been a significant force in mainstreaming the concept, applying the science developed by the world’s leading academics and climate experts.
A carbon budget is a single number that encapsulates the finite limits of our planet’s physical system and highlights the need to reach net zero – if we continue to release emissions on a net basis, the budget is breached and the temperature keeps rising. This conceptual simplicity makes carbon budgets an attractive analytical tool for a wide range of climate change analysis. Budgets may also be reflected in scenario pathways that allow more flexible use. That said, this simplicity belies variations both between budgets (such as the IPCC’s) and between organisations that need to be considered based on the specific use case in question.
Here we consider the updated carbon budgets provided by the IPCC and low-carbon scenarios published by the IEA in 2018 and 2019 respectively. We also consider the implications of aiming for more stringent temperature thresholds (1.5°C), and some key factors that analysts and investors must consider before relying on any given carbon budget.
1.5°C, 2°C or anything in between?
Arguably the most important shift in carbon budgets to have taken place over the last two years is the increased emphasis on the 1.5°C target. While the Paris Agreement commits to “well below” 2 degrees, with climate scientists increasingly warning of the dangerous implications of 2°C warming[i], the accord’s goal of striving for 1.5°C has been catapulted into the limelight. This was underlined in the 1.5°C Special Report (SR15) of the Intergovernmental Panel on Climate Change (IPCC), commissioned at the request of the Paris signatories and released in October 2018, which made the 1.5°C target its focus.
Figure 1: Carbon budgets are smaller and/or have lower probabilities for 1.5°C than for higher-temperature outcomes
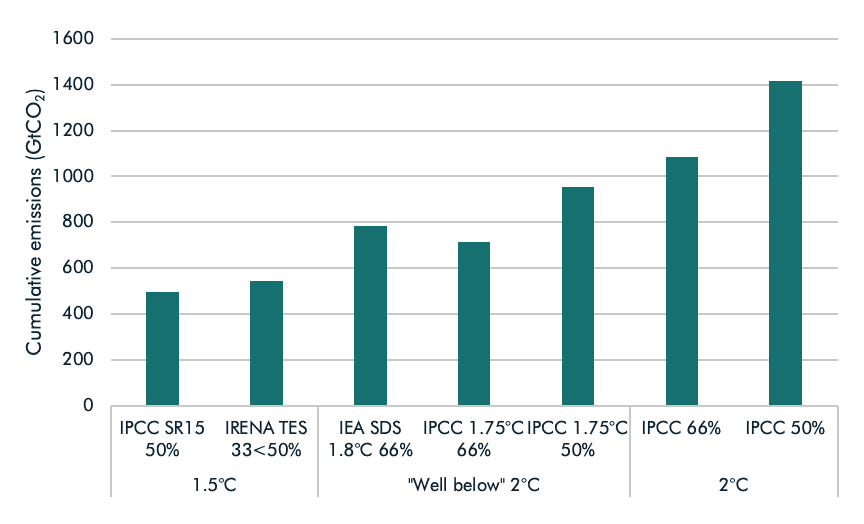
Source: IPCC, IRENA, IEA
Note: Percentages indicate probability of achieving a given warming outcome vs pre-industrial levels. All budgets and scenarios are from 2020 onwards.
Unsurprisingly, striving for that higher-ambition target would have major implications for the size of the earth’s remaining carbon budget and hence a much smaller remaining amount of CO2 that can be emitted. SR15 gives a range of scenarios and warming thresholds, which allows us to make direct comparisons between 1.5°C, 2°C, and anything in between. At a 50% probability of achieving the more stringent 1.5°C target, the carbon budget from 2020 onwards is 65% smaller than for 2°C, at 495 gigatonnes of CO2 (GtCO2), and 48% smaller than that the 1.75°C (‘well below 2°C’) budget.
SR15 carbon budgets are larger than previous estimates
What is also notable about SR15 is that its carbon budgets are bigger overall than in the previous set of carbon budgets developed in the 2013 Fifth Assessment Report (AR5). For example, the SR15 report’s 1.5°C budget (50% probability) is three-fifths (320 GtCO2) larger when calculating it back to the same 2011 baseline as used in AR5. This increase stems from a combination of factors, including a different temperature baseline, more sophisticated modelling and the fact that SR15 splits out Earth System Feedbacks – trigger points such as permafrost thawing that can have sharp, sudden effects on warming – as risk variables rather than assuming their impact. [ii]
Carbon budgets versus scenario pathways
Whereas carbon budgets give the total amount of carbon that can be released, they do not indicate the pathway to that outcome either in terms of the trajectory of emissions over time or the sources of those emissions. Scenarios are used to provide this detail, usually incorporating economic modelling, and may imply a temperature outcome or carbon budget in terms of total emissions released.
For example, the International Energy Agency (IEA) is one of several organisations that publishes such scenarios. Rather than asking what size of CO2 budget corresponds to any given temperature outcome, the IEA scenarios posit different trajectories of technological, policy and economic development, resulting in different temperature outcomes. For example, its Stated Energy Policies Scenario (STEPS) projects forward today’s enacted and announced policies, resulting in a pathway consistent with a 50% chance of limiting warming to 2.7ºC. Conversely, the Sustainable Development Scenario (SDS) lays out a pathway to peak and reduce emissions alongside other sustainable development goals over the period to 2040, with a range of temperature outcomes possible dependent on actions after this point.
The latest SDS, released in 2019, is associated with a remaining 880 GtCO2 ‘budget’ since 2018 by the IEA. This implies a below-33% likelihood of hitting 1.5°C (barring net-negative emissions, see more below), with the chance of staying well below 2°C (defined by the IEA as 1.8°C) at 66%. The same general description applies to the International Renewable Energy Agency’s (IRENA) Transforming Energy Scenario (TES) from April 2020, which has a slightly smaller ‘budget’ at 630 GtCO2 according to Carbon Tracker calculations.[iii]
‘Energy only’ or ‘total’ carbon budget?
A central difference between IEA and IPCC carbon figures is that whereas the IPCC budgets relate to total emissions of CO2, the IEA scenarios focuses primarily on the energy sector, which is the largest single source of anthropogenic CO2 emissions through the burning of coal, oil and gas. The remainder is accounted for by emissions from industries, land use, land-use change and forestry (LULUCF).
The IEA does allocate 80 (of 880) GtCO2 to LULUCF in the SDS but provides very few underlying assumptions about this figure, except that it relies to some extent on net-negative emissions (see more below). LULUCF alone accounted for 13% of global CO2 emissions in 2018[iv], so tweaking these assumptions can have considerable implications for the final ‘budget’ figure.
Figure 2: IEA projections focus mostly on the energy sector, with less detail on assumptions for heavy industries and land use
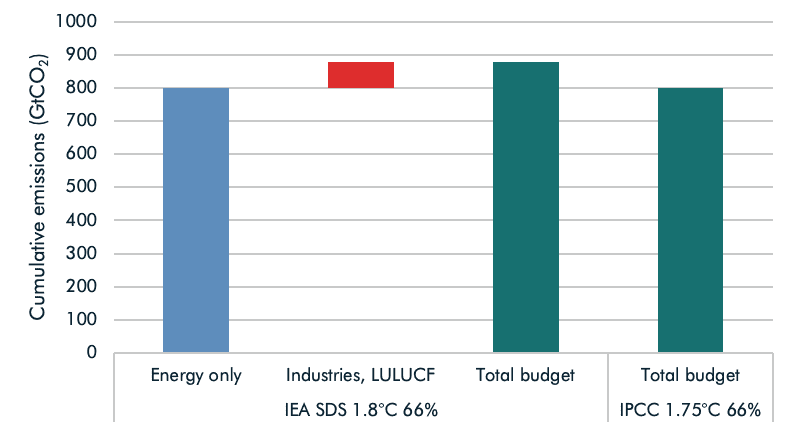
Source: IEA, IPCC
Time frames
Moreover, it is important to determine an overall starting point for the carbon budget. Specifying the level of ‘pre-industrial emissions’ provides a baseline from which anthropogenic activity began influencing greenhouse gas (GHG) concentrations in the atmosphere. How the ‘pre-industrial level’ is defined, however, can vary. 1850-1900 remains the preferred baseline by the IPCC. However, some studies have suggested a 1720-1800 baseline would be more appropriate, because GHG concentrations have been increasing since industrialisation began around 1750.[v] Others argue that baselines should be taken from natural climate model simulations, i.e. those that exclude anthropogenic forcings.[vi]
Next, one needs to consider the start date of the actual carbon budget itself. Usually this will be 1-2 years prior to any given study’s publication date, incorporating the most recent annual emissions data available. The most recent IPCC, IEA and IRENA scenarios calculate remaining budgets as of 1 January 2018, which means that two years’ worth of emissions have already been spent by the beginning of 2020. Using preliminary data from 2019[vii], global emissions in the last two years came in at 85.2 GtCO2, removing 15% of the 1.5°C (50% probability) budget presented in SR15. Similarly, 11% has been spent from the 1.75°C (66% probability) budget. This is illustrated in figure 3 below.
Figure 3: IPCC carbon budgets start in 2018, but emissions since then have been significant
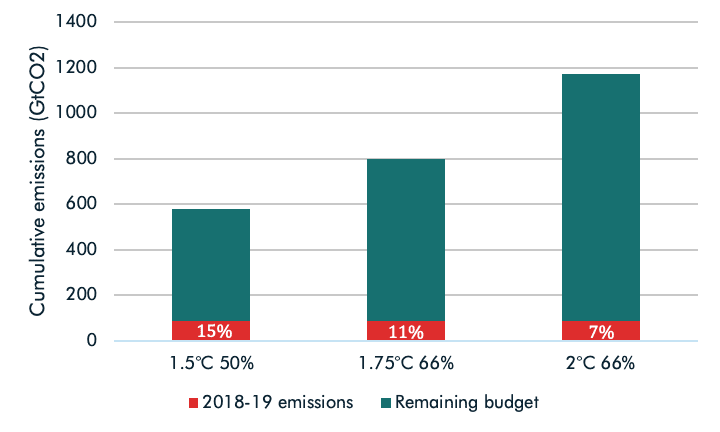
Source: IPCC
IPCC carbon budgets and IEA/IRENA policy scenarios also have different inbuilt assumptions about their endpoints and the extent to which the temperature target can be temporarily breached. Whereas a “true” carbon budget is a total aggregate amount of emissions that can be released, and hence must ultimately reach net zero emissions, scenarios may only cover part of the period leading up to this milestone.
The IEA’s SDS, for example, only projects emissions until 2050; the budgets shown in figures 1 and 2 are calculated by assuming a linear decline to net zero emissions by 2070. IRENA also stops its TES projections at 2050, when it says annual energy-related emissions would still stand at 9.5 GtCO2 (from around 34 in 2019), though offers an additional scenario called the Deeper Decarbonisation Scenario that takes total emissions down to zero by 2060. That ‘last mile’ towards net zero, often constituting heavy industry and LULUCF factors, is especially tricky[viii], which means that the choice of a cut-off point can be a non-negligible variation.
Temperature baseline
Crucially, a carbon budget also needs to specify basis of measurement of the pre-existing global temperature rise. The most commonly used approach, including in AR5 and SR15, is to estimate warming based on modelled global mean near-surface air temperatures (SAT).
SR15 also includes budgets based on global mean surface temperature (GMST) – a blend of historical estimates of observed near-surface air temperatures (SAT) over land and sea ice with sea surface temperatures (SST). Because the air has warmed more than the sea, carbon budgets that are based on measurements of SST can be significantly larger than those based solely on near-surface temperatures – 40% in the case of the 1.5°C, 50% probability SR15 budget.
Non-CO2 greenhouse gases (GHGs) mitigation
CO2 is the largest contributor to climate change, but a number of other GHGs are also significant, e.g. methane, nitrous oxides and F-gases. Therefore, to calculate a carbon budget in terms of remaining CO2 emissions, one must also assume a level of warming stemming from these non-CO2 GHGs. If one assumes a higher level of success in mitigating non-CO2 GHGs, then this leaves space for a higher carbon budget, and vice versa. Swings here can be large: the SR15 models give a range of -650 to +400 GtCO2 for various non-CO2 factors in aggregate in the 1.5°C scenario, which in the most-negative case could mean that the earth’s entire 1.5°C carbon budget is already spent.
Carbon capture and storage and net-negative emissions technologies
Different pathway scenarios also include different levels of carbon capture and storage (CCS). They may also include other technologies that can be used to remove carbon dioxide from the atmosphere (carbon dioxide removal, or CDR), which raises the prospect of “overshooting” temperature targets and subsequently drawing the excess carbon down to return inside a given carbon budget. Some models assume a substantial contribution of such technologies to the world’s ability to keep within its carbon budget – for example the IEA’s SDS, which assumes that fully 9% of total CO2 savings will have come from CCS by 2050, while nearly all of the SR15 1.5°C scenarios involve some level of CCS usage.
Carbon Tracker’s modelling has shown that CCS is likely to be prohibitively expensive to significantly extend the demand profiles for coal, oil and gas, particularly in the power sector where increasingly cheap alternatives are available.[ix] Indeed, fossil fuel use declines even in scenarios that assume significant use of such technologies. [x] While any upside delivery of CCS would help mitigate CO2 emissions, relying on the future growth of what remains a speculative technology is highly risky.[xi] That said, net-negative emissions technologies, which feature heavily in the IPCC’s more restrictive warming scenarios[xii], are not expected to feature until the second half of the 21st century, by which point these technologies may well have become more economically feasible.
Conclusion
Carbon budgets are powerful communication tools to illustrate the finite limits of our planet and the need for rapid action towards net zero. They can therefore help illustrate the inconsistencies inherent in the plans of many carbon-intense industries, as Carbon Tracker analysis has consistently shown ever since our first report on the carbon bubble in 2011.[xiii] [xiv] That said there are a number of variables to check before relying on a carbon budget number in order to make sure that the underlying assumptions are fit for purpose. Analysts and investors must also clearly distinguish between carbon budgets and policy scenarios, given that the latter involve a range of assumptions about how any given warming outcome (and total emissions figure) is made possible. Many of these assumptions – such as the use of CCS – require scrutiny before the policy trajectory can be incorporated into other analysis.
[i] https://climate.nasa.gov/news/2865/a-degree-of-concern-why-global-temperatures-matter/
[ii] https://constrain-eu.org/assets/docs/CONSTRAIN-Zero%20In%20On%20The%20Remaining%20Carbon%20Budget%20&%20Decadal%20Warming%20Rates.pdf
[iii] https://www.irena.org/publications/2020/Apr/Global-Renewables-Outlook-2020
[iv] https://www.globalcarbonproject.org/carbonbudget/index.htm
[v] http://journals.ametsoc.org/doi/10.1175/BAMS-D-16-0007.1
[vi] https://www.nature.com/articles/s41586-019-1368-z
[vii] https://www.globalcarbonproject.org/carbonbudget/19/files/Norway_CICERO_GCB2019.pdf
[viii] https://www.irena.org/publications/2020/Apr/Global-Renewables-Outlook-2020
[ix] https://www.carbontracker.org/reports/expect-the-unexpected-the-disruptive-power-of-low-carbon-technology/
[x] https://carbontracker.org/ccs-important-but-not-a-get-out-of-jail-free-card/
[xi] http://smartstones.nl/wp-content/uploads/2016/12/Kevin-Anderson-2016.10.13-the-Trouble-with-Negative-Emissions-Science-2016.pdf
[xii] https://www.ipcc.ch/site/assets/uploads/sites/2/2019/05/SR15_Chapter2_Low_Res.pdf